Arab vs Immigrants from Micronesia 12th Grade, No Diploma
COMPARE
Arab
Immigrants from Micronesia
12th Grade, No Diploma
12th Grade, No Diploma Comparison
Arabs
Immigrants from Micronesia
91.6%
12TH GRADE, NO DIPLOMA
84.1/ 100
METRIC RATING
138th/ 347
METRIC RANK
90.6%
12TH GRADE, NO DIPLOMA
11.0/ 100
METRIC RATING
208th/ 347
METRIC RANK
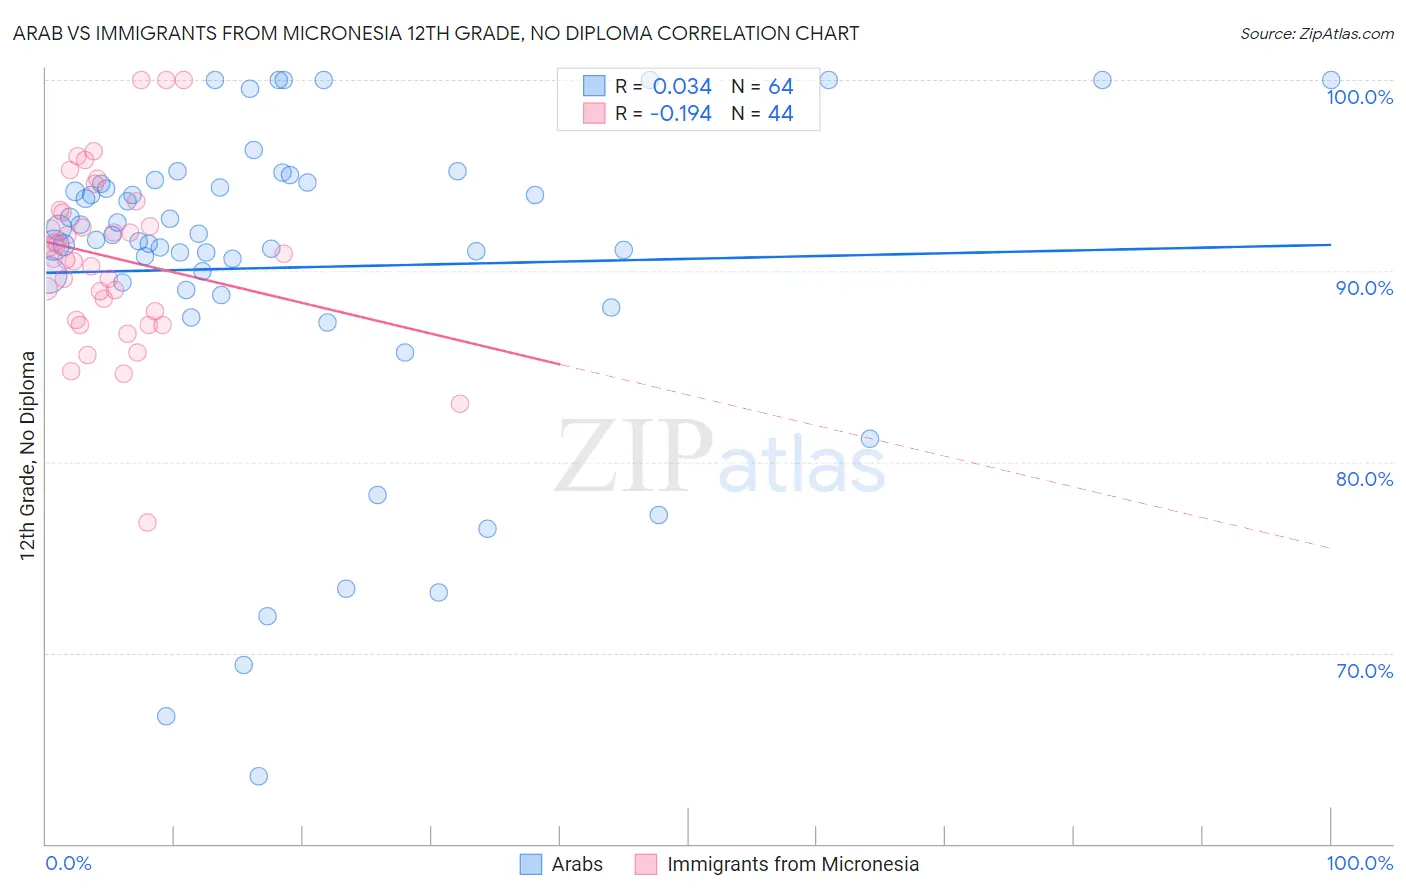
Arab vs Immigrants from Micronesia 12th Grade, No Diploma Correlation Chart
The statistical analysis conducted on geographies consisting of 486,870,847 people shows no correlation between the proportion of Arabs and percentage of population with at least 12th grade (no diploma) education in the United States with a correlation coefficient (R) of 0.034 and weighted average of 91.6%. Similarly, the statistical analysis conducted on geographies consisting of 61,609,499 people shows a poor negative correlation between the proportion of Immigrants from Micronesia and percentage of population with at least 12th grade (no diploma) education in the United States with a correlation coefficient (R) of -0.194 and weighted average of 90.6%, a difference of 1.2%.
12th Grade, No Diploma Correlation Summary
| Measurement | Arab | Immigrants from Micronesia |
| Minimum | 63.5% | 76.9% |
| Maximum | 100.0% | 100.0% |
| Range | 36.5% | 23.1% |
| Mean | 90.2% | 90.7% |
| Median | 91.8% | 90.8% |
| Interquartile 25% (IQ1) | 89.2% | 87.7% |
| Interquartile 75% (IQ3) | 94.6% | 93.1% |
| Interquartile Range (IQR) | 5.4% | 5.5% |
| Standard Deviation (Sample) | 8.4% | 4.6% |
| Standard Deviation (Population) | 8.3% | 4.5% |
Similar Demographics by 12th Grade, No Diploma
Demographics Similar to Arabs by 12th Grade, No Diploma
In terms of 12th grade, no diploma, the demographic groups most similar to Arabs are Immigrants from Egypt (91.6%, a difference of 0.0%), Alaska Native (91.6%, a difference of 0.020%), Chilean (91.7%, a difference of 0.040%), Immigrants from Poland (91.6%, a difference of 0.040%), and Argentinean (91.6%, a difference of 0.050%).
| Demographics | Rating | Rank | 12th Grade, No Diploma |
| Albanians | 89.3 /100 | #131 | Excellent 91.8% |
| Immigrants | Eastern Asia | 89.3 /100 | #132 | Excellent 91.8% |
| Immigrants | Italy | 88.3 /100 | #133 | Excellent 91.7% |
| Venezuelans | 88.2 /100 | #134 | Excellent 91.7% |
| Immigrants | Bosnia and Herzegovina | 87.3 /100 | #135 | Excellent 91.7% |
| Chileans | 85.8 /100 | #136 | Excellent 91.7% |
| Alaska Natives | 84.9 /100 | #137 | Excellent 91.6% |
| Arabs | 84.1 /100 | #138 | Excellent 91.6% |
| Immigrants | Egypt | 83.9 /100 | #139 | Excellent 91.6% |
| Immigrants | Poland | 82.3 /100 | #140 | Excellent 91.6% |
| Argentineans | 82.0 /100 | #141 | Excellent 91.6% |
| Immigrants | Venezuela | 80.9 /100 | #142 | Excellent 91.6% |
| Immigrants | Argentina | 80.7 /100 | #143 | Excellent 91.6% |
| Immigrants | Spain | 80.1 /100 | #144 | Excellent 91.6% |
| Immigrants | Lebanon | 80.0 /100 | #145 | Excellent 91.6% |
Demographics Similar to Immigrants from Micronesia by 12th Grade, No Diploma
In terms of 12th grade, no diploma, the demographic groups most similar to Immigrants from Micronesia are Immigrants from Afghanistan (90.6%, a difference of 0.0%), South American Indian (90.6%, a difference of 0.0%), Portuguese (90.6%, a difference of 0.010%), Armenian (90.6%, a difference of 0.020%), and Somali (90.6%, a difference of 0.030%).
| Demographics | Rating | Rank | 12th Grade, No Diploma |
| Hawaiians | 19.7 /100 | #201 | Poor 90.8% |
| Marshallese | 18.2 /100 | #202 | Poor 90.7% |
| Tongans | 16.1 /100 | #203 | Poor 90.7% |
| French American Indians | 15.5 /100 | #204 | Poor 90.7% |
| Immigrants | Sierra Leone | 14.9 /100 | #205 | Poor 90.7% |
| Immigrants | Bolivia | 12.3 /100 | #206 | Poor 90.6% |
| Armenians | 11.6 /100 | #207 | Poor 90.6% |
| Immigrants | Micronesia | 11.0 /100 | #208 | Poor 90.6% |
| Immigrants | Afghanistan | 11.0 /100 | #209 | Poor 90.6% |
| South American Indians | 10.9 /100 | #210 | Poor 90.6% |
| Portuguese | 10.6 /100 | #211 | Poor 90.6% |
| Somalis | 10.2 /100 | #212 | Poor 90.6% |
| Costa Ricans | 9.4 /100 | #213 | Tragic 90.5% |
| Immigrants | Africa | 8.5 /100 | #214 | Tragic 90.5% |
| Arapaho | 7.7 /100 | #215 | Tragic 90.5% |