Arab vs Immigrants from China 5th Grade
COMPARE
Arab
Immigrants from China
5th Grade
5th Grade Comparison
Arabs
Immigrants from China
97.3%
5TH GRADE
53.4/ 100
METRIC RATING
172nd/ 347
METRIC RANK
96.8%
5TH GRADE
0.5/ 100
METRIC RATING
259th/ 347
METRIC RANK
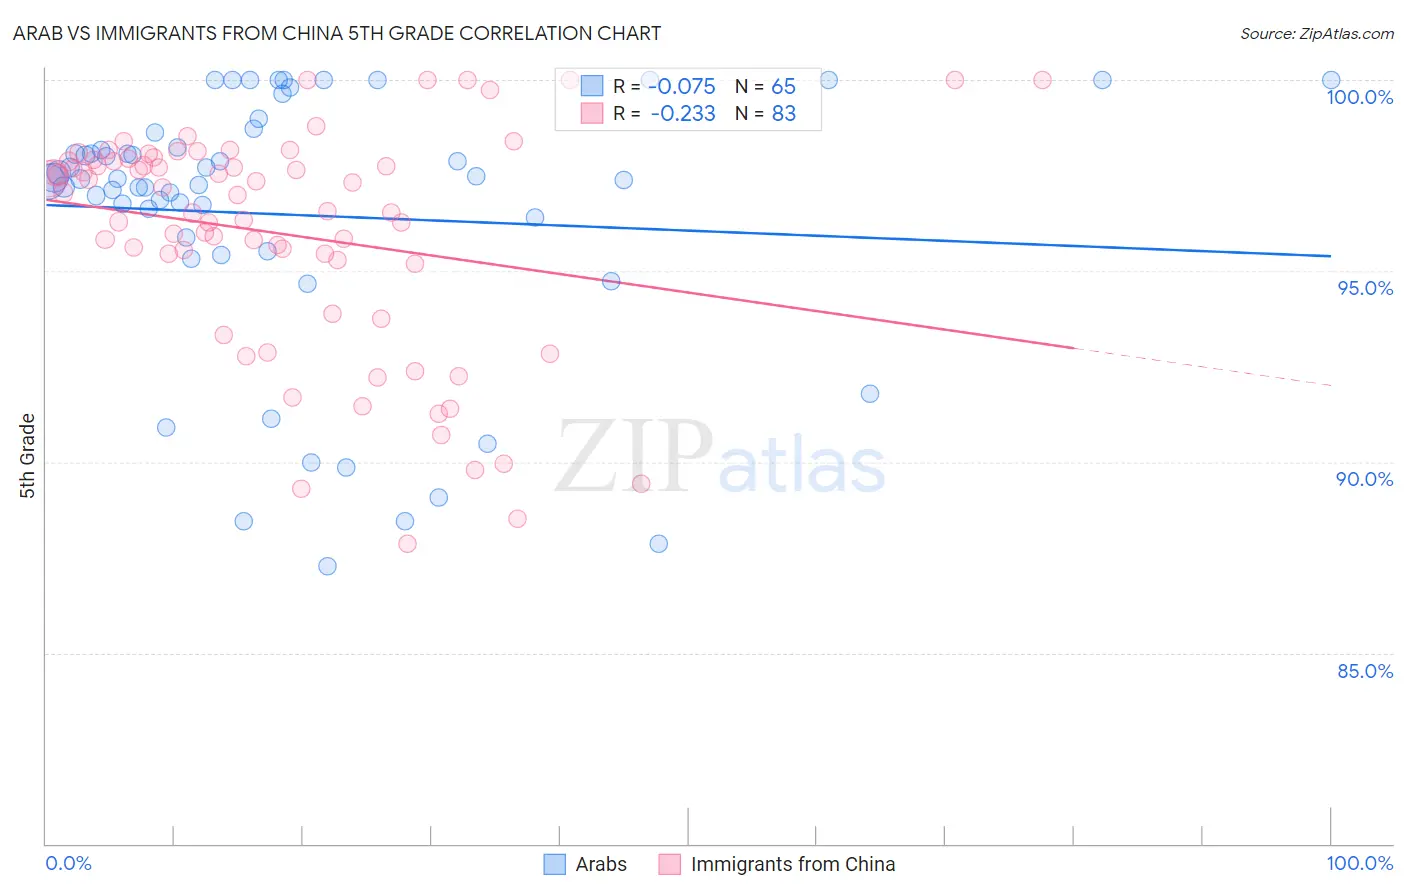
Arab vs Immigrants from China 5th Grade Correlation Chart
The statistical analysis conducted on geographies consisting of 486,871,007 people shows a slight negative correlation between the proportion of Arabs and percentage of population with at least 5th grade education in the United States with a correlation coefficient (R) of -0.075 and weighted average of 97.3%. Similarly, the statistical analysis conducted on geographies consisting of 457,082,957 people shows a weak negative correlation between the proportion of Immigrants from China and percentage of population with at least 5th grade education in the United States with a correlation coefficient (R) of -0.233 and weighted average of 96.8%, a difference of 0.58%.
5th Grade Correlation Summary
| Measurement | Arab | Immigrants from China |
| Minimum | 87.3% | 87.9% |
| Maximum | 100.0% | 100.0% |
| Range | 12.7% | 12.1% |
| Mean | 96.5% | 96.0% |
| Median | 97.4% | 97.0% |
| Interquartile 25% (IQ1) | 95.7% | 95.2% |
| Interquartile 75% (IQ3) | 98.4% | 97.9% |
| Interquartile Range (IQR) | 2.7% | 2.7% |
| Standard Deviation (Sample) | 3.5% | 3.0% |
| Standard Deviation (Population) | 3.4% | 2.9% |
Similar Demographics by 5th Grade
Demographics Similar to Arabs by 5th Grade
In terms of 5th grade, the demographic groups most similar to Arabs are Immigrants from Belarus (97.3%, a difference of 0.0%), Chilean (97.3%, a difference of 0.0%), Immigrants from Korea (97.3%, a difference of 0.0%), Venezuelan (97.3%, a difference of 0.0%), and Immigrants from Sri Lanka (97.3%, a difference of 0.0%).
| Demographics | Rating | Rank | 5th Grade |
| Immigrants | Poland | 57.9 /100 | #165 | Average 97.4% |
| Apache | 57.2 /100 | #166 | Average 97.4% |
| Immigrants | Belarus | 54.6 /100 | #167 | Average 97.3% |
| Chileans | 54.5 /100 | #168 | Average 97.3% |
| Immigrants | Korea | 54.1 /100 | #169 | Average 97.3% |
| Venezuelans | 54.0 /100 | #170 | Average 97.3% |
| Immigrants | Sri Lanka | 53.8 /100 | #171 | Average 97.3% |
| Arabs | 53.4 /100 | #172 | Average 97.3% |
| Egyptians | 52.4 /100 | #173 | Average 97.3% |
| Immigrants | Kazakhstan | 50.0 /100 | #174 | Average 97.3% |
| Immigrants | Micronesia | 48.8 /100 | #175 | Average 97.3% |
| Immigrants | Taiwan | 48.4 /100 | #176 | Average 97.3% |
| Immigrants | Spain | 47.0 /100 | #177 | Average 97.3% |
| Comanche | 42.1 /100 | #178 | Average 97.3% |
| Immigrants | Kenya | 40.3 /100 | #179 | Average 97.3% |
Demographics Similar to Immigrants from China by 5th Grade
In terms of 5th grade, the demographic groups most similar to Immigrants from China are Immigrants from Ethiopia (96.8%, a difference of 0.0%), Immigrants from Jamaica (96.8%, a difference of 0.020%), Immigrants from Sierra Leone (96.8%, a difference of 0.020%), Immigrants from Colombia (96.8%, a difference of 0.020%), and Peruvian (96.8%, a difference of 0.030%).
| Demographics | Rating | Rank | 5th Grade |
| Jamaicans | 0.9 /100 | #252 | Tragic 96.9% |
| Immigrants | Middle Africa | 0.8 /100 | #253 | Tragic 96.8% |
| Immigrants | Senegal | 0.8 /100 | #254 | Tragic 96.8% |
| South Americans | 0.7 /100 | #255 | Tragic 96.8% |
| Immigrants | Congo | 0.7 /100 | #256 | Tragic 96.8% |
| Peruvians | 0.6 /100 | #257 | Tragic 96.8% |
| Immigrants | Ethiopia | 0.5 /100 | #258 | Tragic 96.8% |
| Immigrants | China | 0.5 /100 | #259 | Tragic 96.8% |
| Immigrants | Jamaica | 0.4 /100 | #260 | Tragic 96.8% |
| Immigrants | Sierra Leone | 0.4 /100 | #261 | Tragic 96.8% |
| Immigrants | Colombia | 0.4 /100 | #262 | Tragic 96.8% |
| Immigrants | Uzbekistan | 0.3 /100 | #263 | Tragic 96.8% |
| West Indians | 0.3 /100 | #264 | Tragic 96.8% |
| Taiwanese | 0.3 /100 | #265 | Tragic 96.7% |
| Immigrants | Nigeria | 0.3 /100 | #266 | Tragic 96.7% |