Arab vs Dominican 5th Grade
COMPARE
Arab
Dominican
5th Grade
5th Grade Comparison
Arabs
Dominicans
97.3%
5TH GRADE
53.4/ 100
METRIC RATING
172nd/ 347
METRIC RANK
95.5%
5TH GRADE
0.0/ 100
METRIC RATING
327th/ 347
METRIC RANK
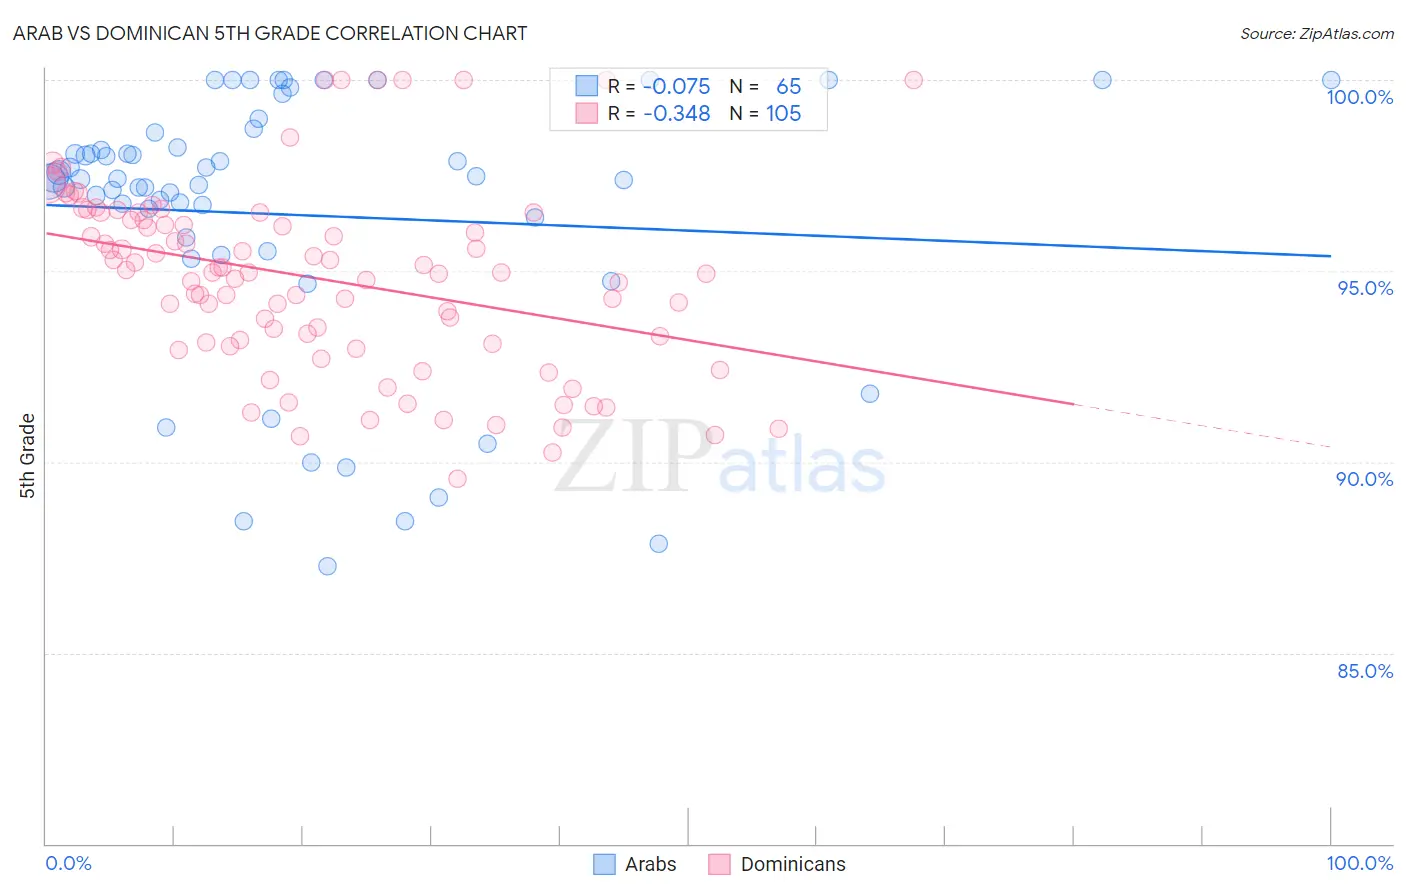
Arab vs Dominican 5th Grade Correlation Chart
The statistical analysis conducted on geographies consisting of 486,871,007 people shows a slight negative correlation between the proportion of Arabs and percentage of population with at least 5th grade education in the United States with a correlation coefficient (R) of -0.075 and weighted average of 97.3%. Similarly, the statistical analysis conducted on geographies consisting of 355,142,603 people shows a mild negative correlation between the proportion of Dominicans and percentage of population with at least 5th grade education in the United States with a correlation coefficient (R) of -0.348 and weighted average of 95.5%, a difference of 1.9%.
5th Grade Correlation Summary
| Measurement | Arab | Dominican |
| Minimum | 87.3% | 89.6% |
| Maximum | 100.0% | 100.0% |
| Range | 12.7% | 10.4% |
| Mean | 96.5% | 94.8% |
| Median | 97.4% | 95.0% |
| Interquartile 25% (IQ1) | 95.7% | 93.1% |
| Interquartile 75% (IQ3) | 98.4% | 96.4% |
| Interquartile Range (IQR) | 2.7% | 3.3% |
| Standard Deviation (Sample) | 3.5% | 2.4% |
| Standard Deviation (Population) | 3.4% | 2.4% |
Similar Demographics by 5th Grade
Demographics Similar to Arabs by 5th Grade
In terms of 5th grade, the demographic groups most similar to Arabs are Immigrants from Belarus (97.3%, a difference of 0.0%), Chilean (97.3%, a difference of 0.0%), Immigrants from Korea (97.3%, a difference of 0.0%), Venezuelan (97.3%, a difference of 0.0%), and Immigrants from Sri Lanka (97.3%, a difference of 0.0%).
| Demographics | Rating | Rank | 5th Grade |
| Immigrants | Poland | 57.9 /100 | #165 | Average 97.4% |
| Apache | 57.2 /100 | #166 | Average 97.4% |
| Immigrants | Belarus | 54.6 /100 | #167 | Average 97.3% |
| Chileans | 54.5 /100 | #168 | Average 97.3% |
| Immigrants | Korea | 54.1 /100 | #169 | Average 97.3% |
| Venezuelans | 54.0 /100 | #170 | Average 97.3% |
| Immigrants | Sri Lanka | 53.8 /100 | #171 | Average 97.3% |
| Arabs | 53.4 /100 | #172 | Average 97.3% |
| Egyptians | 52.4 /100 | #173 | Average 97.3% |
| Immigrants | Kazakhstan | 50.0 /100 | #174 | Average 97.3% |
| Immigrants | Micronesia | 48.8 /100 | #175 | Average 97.3% |
| Immigrants | Taiwan | 48.4 /100 | #176 | Average 97.3% |
| Immigrants | Spain | 47.0 /100 | #177 | Average 97.3% |
| Comanche | 42.1 /100 | #178 | Average 97.3% |
| Immigrants | Kenya | 40.3 /100 | #179 | Average 97.3% |
Demographics Similar to Dominicans by 5th Grade
In terms of 5th grade, the demographic groups most similar to Dominicans are Immigrants from Cambodia (95.5%, a difference of 0.0%), Honduran (95.6%, a difference of 0.030%), Hispanic or Latino (95.6%, a difference of 0.030%), Cape Verdean (95.5%, a difference of 0.030%), and Mexican American Indian (95.5%, a difference of 0.040%).
| Demographics | Rating | Rank | 5th Grade |
| Central American Indians | 0.0 /100 | #320 | Tragic 95.7% |
| Immigrants | Belize | 0.0 /100 | #321 | Tragic 95.7% |
| Immigrants | Nicaragua | 0.0 /100 | #322 | Tragic 95.6% |
| Immigrants | Fiji | 0.0 /100 | #323 | Tragic 95.6% |
| Hondurans | 0.0 /100 | #324 | Tragic 95.6% |
| Hispanics or Latinos | 0.0 /100 | #325 | Tragic 95.6% |
| Immigrants | Cambodia | 0.0 /100 | #326 | Tragic 95.5% |
| Dominicans | 0.0 /100 | #327 | Tragic 95.5% |
| Cape Verdeans | 0.0 /100 | #328 | Tragic 95.5% |
| Mexican American Indians | 0.0 /100 | #329 | Tragic 95.5% |
| Immigrants | Armenia | 0.0 /100 | #330 | Tragic 95.4% |
| Immigrants | Honduras | 0.0 /100 | #331 | Tragic 95.4% |
| Immigrants | Dominican Republic | 0.0 /100 | #332 | Tragic 95.3% |
| Immigrants | Latin America | 0.0 /100 | #333 | Tragic 95.3% |
| Nepalese | 0.0 /100 | #334 | Tragic 95.2% |