Arab vs Russian 5th Grade
COMPARE
Arab
Russian
5th Grade
5th Grade Comparison
Arabs
Russians
97.3%
5TH GRADE
53.4/ 100
METRIC RATING
172nd/ 347
METRIC RANK
97.9%
5TH GRADE
99.7/ 100
METRIC RATING
63rd/ 347
METRIC RANK
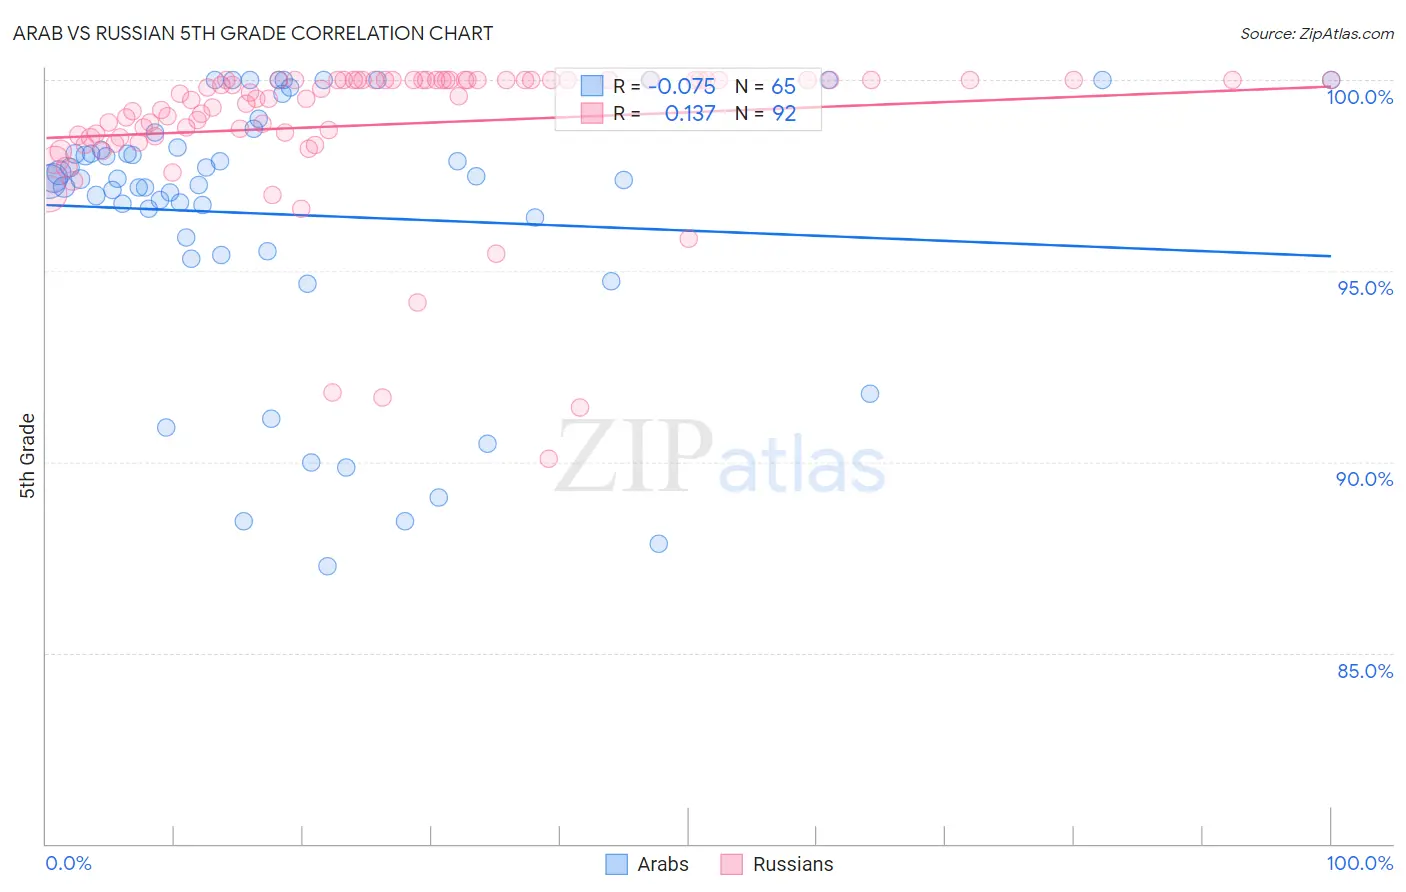
Arab vs Russian 5th Grade Correlation Chart
The statistical analysis conducted on geographies consisting of 486,871,007 people shows a slight negative correlation between the proportion of Arabs and percentage of population with at least 5th grade education in the United States with a correlation coefficient (R) of -0.075 and weighted average of 97.3%. Similarly, the statistical analysis conducted on geographies consisting of 512,259,139 people shows a poor positive correlation between the proportion of Russians and percentage of population with at least 5th grade education in the United States with a correlation coefficient (R) of 0.137 and weighted average of 97.9%, a difference of 0.59%.
5th Grade Correlation Summary
| Measurement | Arab | Russian |
| Minimum | 87.3% | 90.1% |
| Maximum | 100.0% | 100.0% |
| Range | 12.7% | 9.9% |
| Mean | 96.5% | 98.8% |
| Median | 97.4% | 99.5% |
| Interquartile 25% (IQ1) | 95.7% | 98.5% |
| Interquartile 75% (IQ3) | 98.4% | 100.0% |
| Interquartile Range (IQR) | 2.7% | 1.5% |
| Standard Deviation (Sample) | 3.5% | 2.0% |
| Standard Deviation (Population) | 3.4% | 2.0% |
Similar Demographics by 5th Grade
Demographics Similar to Arabs by 5th Grade
In terms of 5th grade, the demographic groups most similar to Arabs are Immigrants from Belarus (97.3%, a difference of 0.0%), Chilean (97.3%, a difference of 0.0%), Immigrants from Korea (97.3%, a difference of 0.0%), Venezuelan (97.3%, a difference of 0.0%), and Immigrants from Sri Lanka (97.3%, a difference of 0.0%).
| Demographics | Rating | Rank | 5th Grade |
| Immigrants | Poland | 57.9 /100 | #165 | Average 97.4% |
| Apache | 57.2 /100 | #166 | Average 97.4% |
| Immigrants | Belarus | 54.6 /100 | #167 | Average 97.3% |
| Chileans | 54.5 /100 | #168 | Average 97.3% |
| Immigrants | Korea | 54.1 /100 | #169 | Average 97.3% |
| Venezuelans | 54.0 /100 | #170 | Average 97.3% |
| Immigrants | Sri Lanka | 53.8 /100 | #171 | Average 97.3% |
| Arabs | 53.4 /100 | #172 | Average 97.3% |
| Egyptians | 52.4 /100 | #173 | Average 97.3% |
| Immigrants | Kazakhstan | 50.0 /100 | #174 | Average 97.3% |
| Immigrants | Micronesia | 48.8 /100 | #175 | Average 97.3% |
| Immigrants | Taiwan | 48.4 /100 | #176 | Average 97.3% |
| Immigrants | Spain | 47.0 /100 | #177 | Average 97.3% |
| Comanche | 42.1 /100 | #178 | Average 97.3% |
| Immigrants | Kenya | 40.3 /100 | #179 | Average 97.3% |
Demographics Similar to Russians by 5th Grade
In terms of 5th grade, the demographic groups most similar to Russians are Immigrants from Canada (97.9%, a difference of 0.010%), Serbian (97.9%, a difference of 0.010%), Immigrants from North America (97.9%, a difference of 0.010%), American (97.9%, a difference of 0.020%), and Immigrants from Northern Europe (97.9%, a difference of 0.020%).
| Demographics | Rating | Rank | 5th Grade |
| Greeks | 99.8 /100 | #56 | Exceptional 97.9% |
| Austrians | 99.8 /100 | #57 | Exceptional 97.9% |
| Whites/Caucasians | 99.8 /100 | #58 | Exceptional 97.9% |
| Americans | 99.7 /100 | #59 | Exceptional 97.9% |
| Immigrants | Canada | 99.7 /100 | #60 | Exceptional 97.9% |
| Serbians | 99.7 /100 | #61 | Exceptional 97.9% |
| Immigrants | North America | 99.7 /100 | #62 | Exceptional 97.9% |
| Russians | 99.7 /100 | #63 | Exceptional 97.9% |
| Immigrants | Northern Europe | 99.6 /100 | #64 | Exceptional 97.9% |
| Canadians | 99.6 /100 | #65 | Exceptional 97.9% |
| Immigrants | Austria | 99.6 /100 | #66 | Exceptional 97.9% |
| New Zealanders | 99.6 /100 | #67 | Exceptional 97.9% |
| Cajuns | 99.6 /100 | #68 | Exceptional 97.9% |
| Kiowa | 99.5 /100 | #69 | Exceptional 97.9% |
| Iranians | 99.5 /100 | #70 | Exceptional 97.9% |