Latvian vs Immigrants from China 5th Grade
COMPARE
Latvian
Immigrants from China
5th Grade
5th Grade Comparison
Latvians
Immigrants from China
98.1%
5TH GRADE
99.9/ 100
METRIC RATING
37th/ 347
METRIC RANK
96.8%
5TH GRADE
0.5/ 100
METRIC RATING
259th/ 347
METRIC RANK
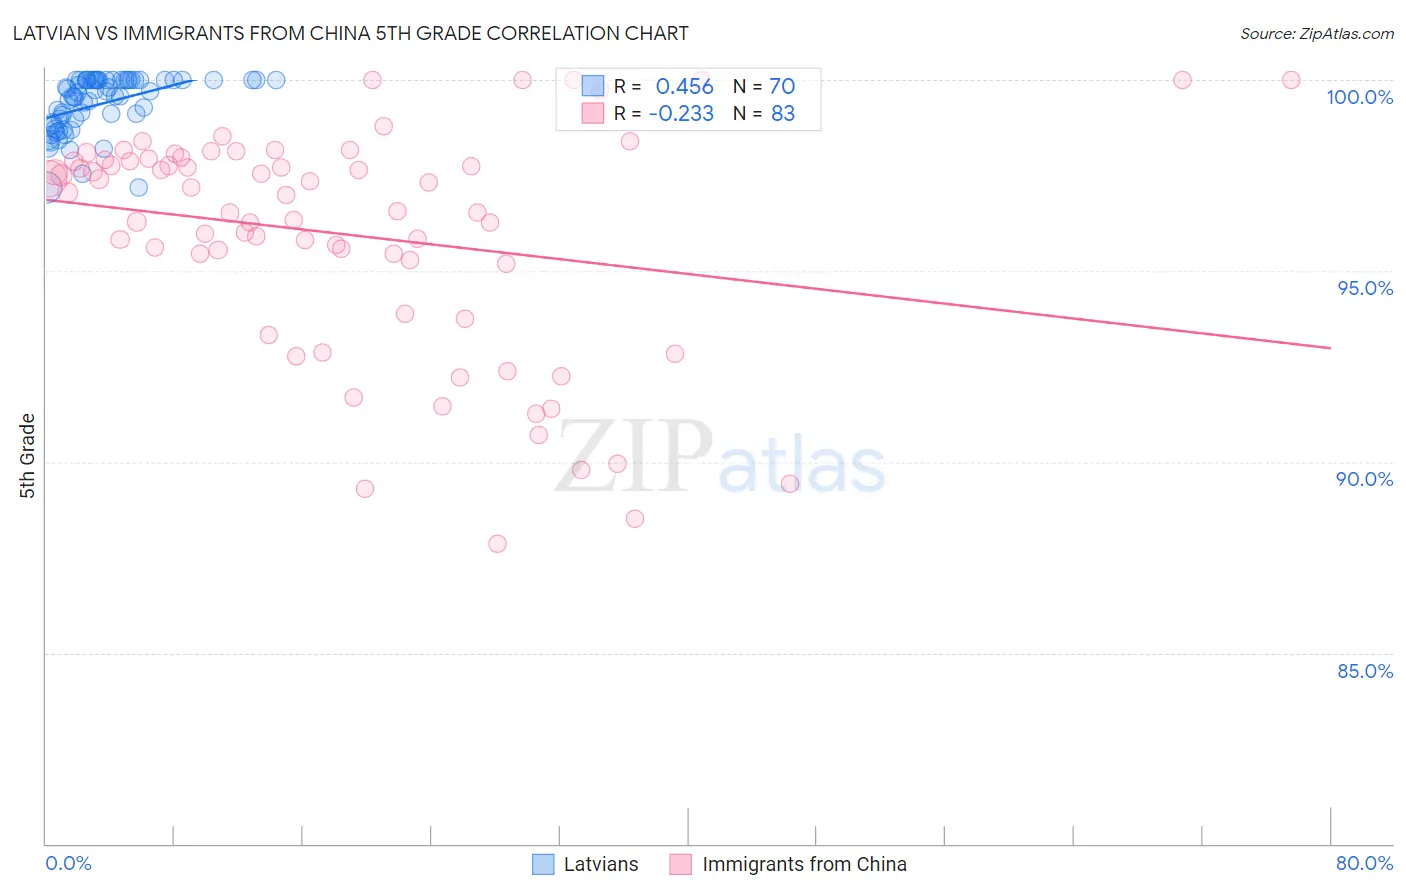
Latvian vs Immigrants from China 5th Grade Correlation Chart
The statistical analysis conducted on geographies consisting of 220,726,452 people shows a moderate positive correlation between the proportion of Latvians and percentage of population with at least 5th grade education in the United States with a correlation coefficient (R) of 0.456 and weighted average of 98.1%. Similarly, the statistical analysis conducted on geographies consisting of 457,082,957 people shows a weak negative correlation between the proportion of Immigrants from China and percentage of population with at least 5th grade education in the United States with a correlation coefficient (R) of -0.233 and weighted average of 96.8%, a difference of 1.3%.
5th Grade Correlation Summary
| Measurement | Latvian | Immigrants from China |
| Minimum | 97.2% | 87.9% |
| Maximum | 100.0% | 100.0% |
| Range | 2.8% | 12.1% |
| Mean | 99.4% | 96.0% |
| Median | 99.6% | 97.0% |
| Interquartile 25% (IQ1) | 98.9% | 95.2% |
| Interquartile 75% (IQ3) | 100.0% | 97.9% |
| Interquartile Range (IQR) | 1.1% | 2.7% |
| Standard Deviation (Sample) | 0.73% | 3.0% |
| Standard Deviation (Population) | 0.73% | 2.9% |
Similar Demographics by 5th Grade
Demographics Similar to Latvians by 5th Grade
In terms of 5th grade, the demographic groups most similar to Latvians are Belgian (98.1%, a difference of 0.010%), Luxembourger (98.1%, a difference of 0.010%), British (98.1%, a difference of 0.020%), Eastern European (98.1%, a difference of 0.020%), and Italian (98.1%, a difference of 0.030%).
| Demographics | Rating | Rank | 5th Grade |
| French Canadians | 100.0 /100 | #30 | Exceptional 98.2% |
| Europeans | 100.0 /100 | #31 | Exceptional 98.2% |
| Chippewa | 100.0 /100 | #32 | Exceptional 98.1% |
| Swiss | 100.0 /100 | #33 | Exceptional 98.1% |
| Chinese | 100.0 /100 | #34 | Exceptional 98.1% |
| Italians | 100.0 /100 | #35 | Exceptional 98.1% |
| British | 100.0 /100 | #36 | Exceptional 98.1% |
| Latvians | 99.9 /100 | #37 | Exceptional 98.1% |
| Belgians | 99.9 /100 | #38 | Exceptional 98.1% |
| Luxembourgers | 99.9 /100 | #39 | Exceptional 98.1% |
| Eastern Europeans | 99.9 /100 | #40 | Exceptional 98.1% |
| Hungarians | 99.9 /100 | #41 | Exceptional 98.0% |
| Northern Europeans | 99.9 /100 | #42 | Exceptional 98.0% |
| Ottawa | 99.9 /100 | #43 | Exceptional 98.0% |
| Aleuts | 99.9 /100 | #44 | Exceptional 98.0% |
Demographics Similar to Immigrants from China by 5th Grade
In terms of 5th grade, the demographic groups most similar to Immigrants from China are Immigrants from Ethiopia (96.8%, a difference of 0.0%), Immigrants from Jamaica (96.8%, a difference of 0.020%), Immigrants from Sierra Leone (96.8%, a difference of 0.020%), Immigrants from Colombia (96.8%, a difference of 0.020%), and Peruvian (96.8%, a difference of 0.030%).
| Demographics | Rating | Rank | 5th Grade |
| Jamaicans | 0.9 /100 | #252 | Tragic 96.9% |
| Immigrants | Middle Africa | 0.8 /100 | #253 | Tragic 96.8% |
| Immigrants | Senegal | 0.8 /100 | #254 | Tragic 96.8% |
| South Americans | 0.7 /100 | #255 | Tragic 96.8% |
| Immigrants | Congo | 0.7 /100 | #256 | Tragic 96.8% |
| Peruvians | 0.6 /100 | #257 | Tragic 96.8% |
| Immigrants | Ethiopia | 0.5 /100 | #258 | Tragic 96.8% |
| Immigrants | China | 0.5 /100 | #259 | Tragic 96.8% |
| Immigrants | Jamaica | 0.4 /100 | #260 | Tragic 96.8% |
| Immigrants | Sierra Leone | 0.4 /100 | #261 | Tragic 96.8% |
| Immigrants | Colombia | 0.4 /100 | #262 | Tragic 96.8% |
| Immigrants | Uzbekistan | 0.3 /100 | #263 | Tragic 96.8% |
| West Indians | 0.3 /100 | #264 | Tragic 96.8% |
| Taiwanese | 0.3 /100 | #265 | Tragic 96.7% |
| Immigrants | Nigeria | 0.3 /100 | #266 | Tragic 96.7% |