Immigrants from Nepal vs Pueblo Professional Degree
COMPARE
Immigrants from Nepal
Pueblo
Professional Degree
Professional Degree Comparison
Immigrants from Nepal
Pueblo
4.8%
PROFESSIONAL DEGREE
91.4/ 100
METRIC RATING
131st/ 347
METRIC RANK
3.7%
PROFESSIONAL DEGREE
1.4/ 100
METRIC RATING
253rd/ 347
METRIC RANK
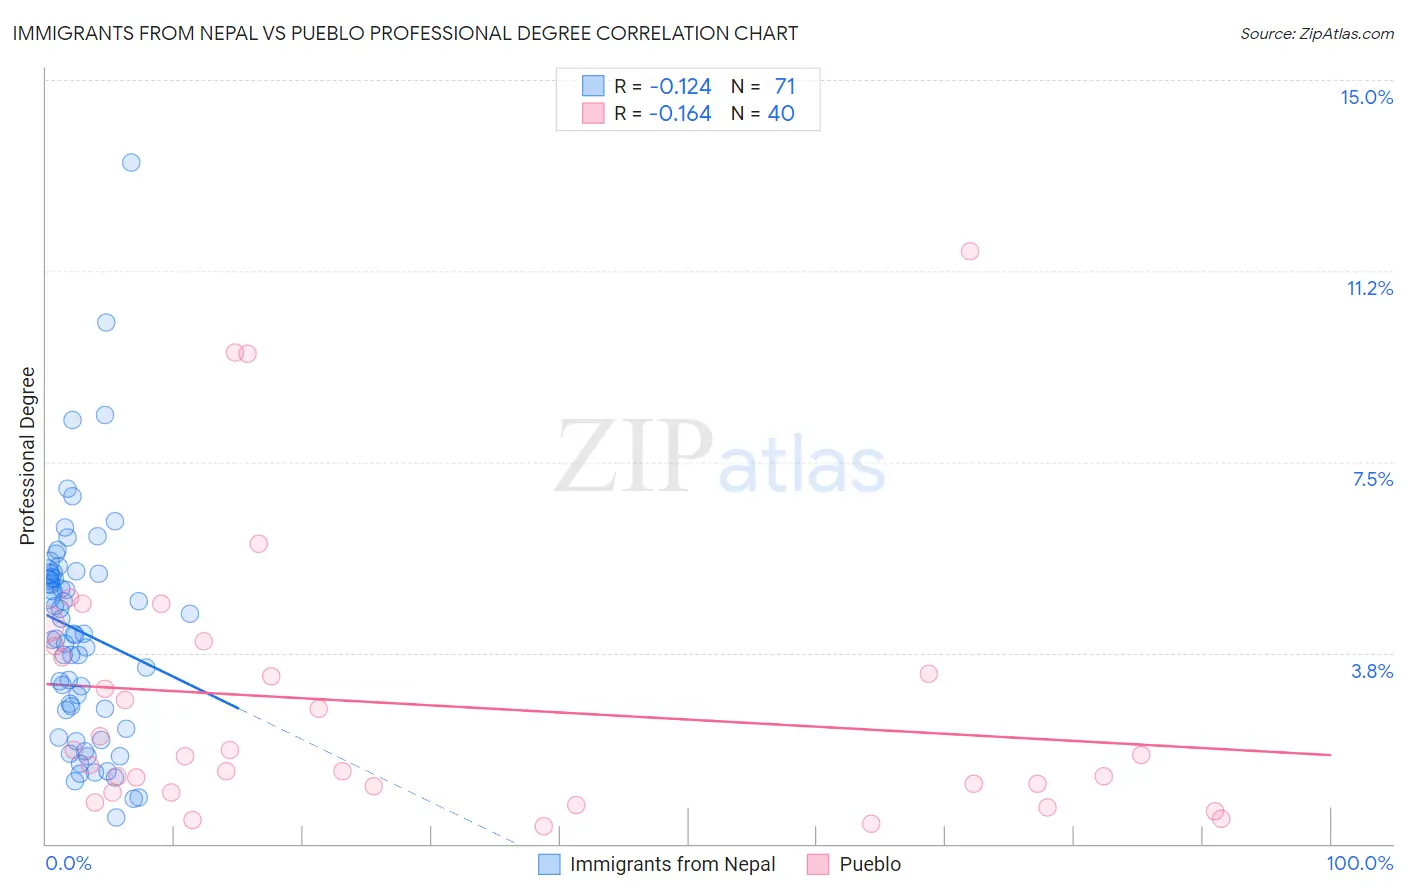
Immigrants from Nepal vs Pueblo Professional Degree Correlation Chart
The statistical analysis conducted on geographies consisting of 186,663,836 people shows a poor negative correlation between the proportion of Immigrants from Nepal and percentage of population with at least professional degree education in the United States with a correlation coefficient (R) of -0.124 and weighted average of 4.8%. Similarly, the statistical analysis conducted on geographies consisting of 119,857,824 people shows a poor negative correlation between the proportion of Pueblo and percentage of population with at least professional degree education in the United States with a correlation coefficient (R) of -0.164 and weighted average of 3.7%, a difference of 28.6%.
Professional Degree Correlation Summary
| Measurement | Immigrants from Nepal | Pueblo |
| Minimum | 0.52% | 0.33% |
| Maximum | 13.4% | 11.6% |
| Range | 12.9% | 11.3% |
| Mean | 4.2% | 2.7% |
| Median | 4.1% | 1.7% |
| Interquartile 25% (IQ1) | 2.6% | 1.1% |
| Interquartile 75% (IQ3) | 5.3% | 3.8% |
| Interquartile Range (IQR) | 2.7% | 2.7% |
| Standard Deviation (Sample) | 2.2% | 2.6% |
| Standard Deviation (Population) | 2.2% | 2.6% |
Similar Demographics by Professional Degree
Demographics Similar to Immigrants from Nepal by Professional Degree
In terms of professional degree, the demographic groups most similar to Immigrants from Nepal are Icelander (4.8%, a difference of 0.030%), Palestinian (4.8%, a difference of 0.050%), Pakistani (4.8%, a difference of 0.22%), Italian (4.8%, a difference of 0.48%), and Immigrants from Eastern Africa (4.8%, a difference of 0.51%).
| Demographics | Rating | Rank | Professional Degree |
| Immigrants | Eritrea | 93.5 /100 | #124 | Exceptional 4.8% |
| Immigrants | Albania | 93.3 /100 | #125 | Exceptional 4.8% |
| Europeans | 93.2 /100 | #126 | Exceptional 4.8% |
| Serbians | 92.6 /100 | #127 | Exceptional 4.8% |
| Immigrants | Eastern Africa | 92.5 /100 | #128 | Exceptional 4.8% |
| Palestinians | 91.5 /100 | #129 | Exceptional 4.8% |
| Icelanders | 91.5 /100 | #130 | Exceptional 4.8% |
| Immigrants | Nepal | 91.4 /100 | #131 | Exceptional 4.8% |
| Pakistanis | 90.9 /100 | #132 | Exceptional 4.8% |
| Italians | 90.2 /100 | #133 | Exceptional 4.8% |
| South American Indians | 89.9 /100 | #134 | Excellent 4.8% |
| Macedonians | 89.8 /100 | #135 | Excellent 4.8% |
| Immigrants | Jordan | 89.0 /100 | #136 | Excellent 4.7% |
| Jordanians | 88.9 /100 | #137 | Excellent 4.7% |
| Afghans | 88.8 /100 | #138 | Excellent 4.7% |
Demographics Similar to Pueblo by Professional Degree
In terms of professional degree, the demographic groups most similar to Pueblo are Jamaican (3.7%, a difference of 0.10%), Tongan (3.7%, a difference of 0.14%), Immigrants from Nicaragua (3.7%, a difference of 0.24%), Immigrants from Fiji (3.7%, a difference of 0.50%), and Immigrants from Grenada (3.7%, a difference of 0.56%).
| Demographics | Rating | Rank | Professional Degree |
| Marshallese | 1.7 /100 | #246 | Tragic 3.8% |
| Guyanese | 1.6 /100 | #247 | Tragic 3.8% |
| Hmong | 1.6 /100 | #248 | Tragic 3.7% |
| Immigrants | Grenada | 1.5 /100 | #249 | Tragic 3.7% |
| Immigrants | Fiji | 1.5 /100 | #250 | Tragic 3.7% |
| Immigrants | Nicaragua | 1.4 /100 | #251 | Tragic 3.7% |
| Jamaicans | 1.4 /100 | #252 | Tragic 3.7% |
| Pueblo | 1.4 /100 | #253 | Tragic 3.7% |
| Tongans | 1.3 /100 | #254 | Tragic 3.7% |
| Osage | 1.2 /100 | #255 | Tragic 3.7% |
| Iroquois | 1.2 /100 | #256 | Tragic 3.7% |
| Bahamians | 1.1 /100 | #257 | Tragic 3.7% |
| Immigrants | St. Vincent and the Grenadines | 1.1 /100 | #258 | Tragic 3.7% |
| Africans | 1.0 /100 | #259 | Tragic 3.7% |
| Indonesians | 1.0 /100 | #260 | Tragic 3.7% |