Apache vs Latvian 11th Grade
COMPARE
Apache
Latvian
11th Grade
11th Grade Comparison
Apache
Latvians
90.4%
11TH GRADE
0.0/ 100
METRIC RATING
287th/ 347
METRIC RANK
94.7%
11TH GRADE
100.0/ 100
METRIC RATING
12th/ 347
METRIC RANK
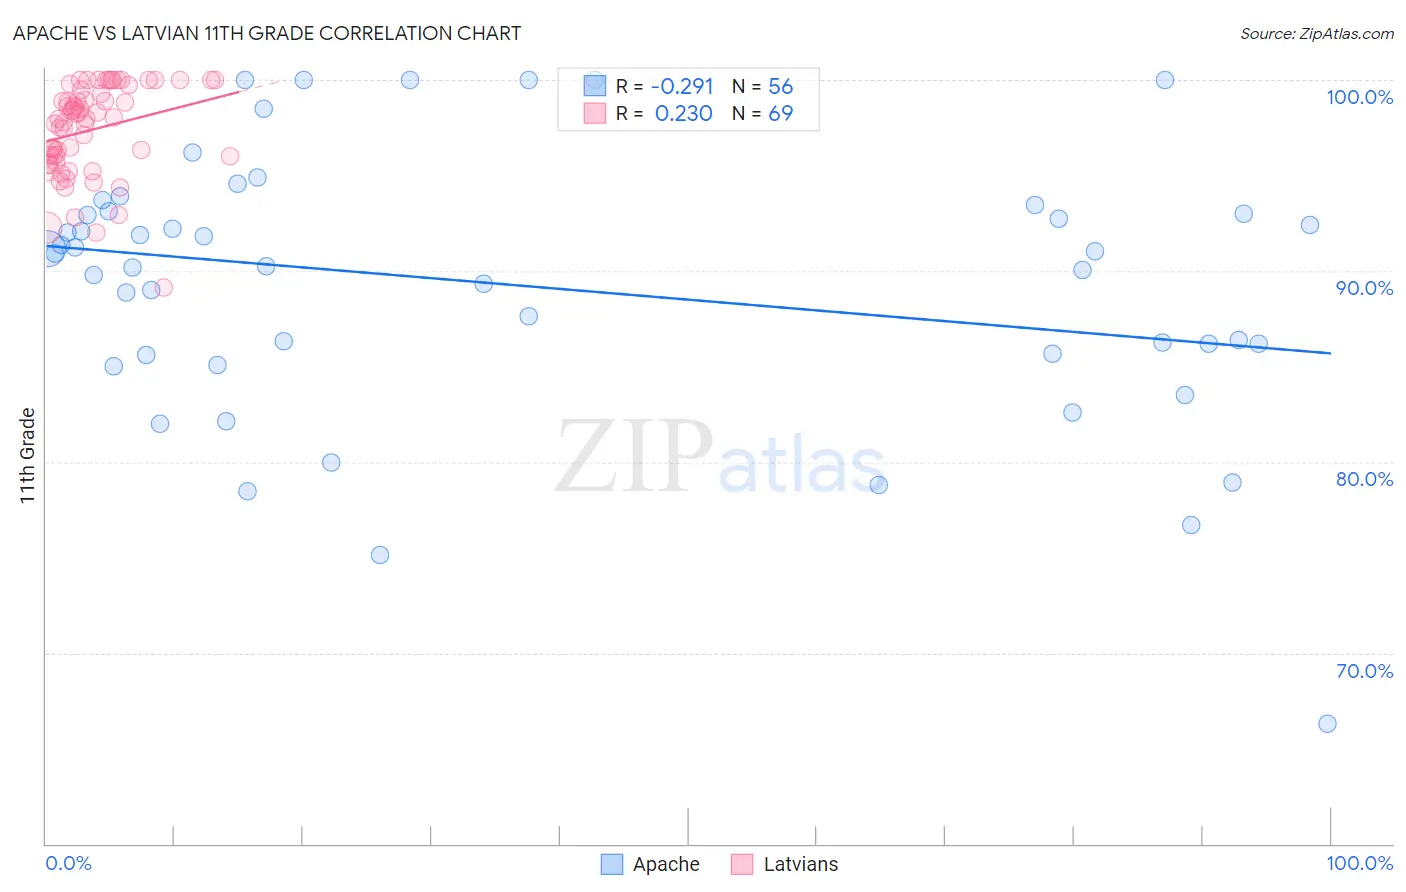
Apache vs Latvian 11th Grade Correlation Chart
The statistical analysis conducted on geographies consisting of 231,143,094 people shows a weak negative correlation between the proportion of Apache and percentage of population with at least 11th grade education in the United States with a correlation coefficient (R) of -0.291 and weighted average of 90.4%. Similarly, the statistical analysis conducted on geographies consisting of 220,726,252 people shows a weak positive correlation between the proportion of Latvians and percentage of population with at least 11th grade education in the United States with a correlation coefficient (R) of 0.230 and weighted average of 94.7%, a difference of 4.8%.
11th Grade Correlation Summary
| Measurement | Apache | Latvian |
| Minimum | 66.3% | 89.1% |
| Maximum | 100.0% | 100.0% |
| Range | 33.7% | 10.9% |
| Mean | 89.2% | 97.4% |
| Median | 90.6% | 98.0% |
| Interquartile 25% (IQ1) | 85.6% | 95.8% |
| Interquartile 75% (IQ3) | 93.1% | 99.4% |
| Interquartile Range (IQR) | 7.4% | 3.6% |
| Standard Deviation (Sample) | 7.0% | 2.4% |
| Standard Deviation (Population) | 6.9% | 2.4% |
Similar Demographics by 11th Grade
Demographics Similar to Apache by 11th Grade
In terms of 11th grade, the demographic groups most similar to Apache are Immigrants from West Indies (90.4%, a difference of 0.010%), Pennsylvania German (90.3%, a difference of 0.020%), British West Indian (90.3%, a difference of 0.050%), Immigrants from Burma/Myanmar (90.4%, a difference of 0.060%), and Indonesian (90.3%, a difference of 0.070%).
| Demographics | Rating | Rank | 11th Grade |
| Sri Lankans | 0.0 /100 | #280 | Tragic 90.7% |
| Dutch West Indians | 0.0 /100 | #281 | Tragic 90.7% |
| Immigrants | St. Vincent and the Grenadines | 0.0 /100 | #282 | Tragic 90.7% |
| Immigrants | Barbados | 0.0 /100 | #283 | Tragic 90.7% |
| Immigrants | Laos | 0.0 /100 | #284 | Tragic 90.5% |
| Immigrants | Burma/Myanmar | 0.0 /100 | #285 | Tragic 90.4% |
| Immigrants | West Indies | 0.0 /100 | #286 | Tragic 90.4% |
| Apache | 0.0 /100 | #287 | Tragic 90.4% |
| Pennsylvania Germans | 0.0 /100 | #288 | Tragic 90.3% |
| British West Indians | 0.0 /100 | #289 | Tragic 90.3% |
| Indonesians | 0.0 /100 | #290 | Tragic 90.3% |
| Haitians | 0.0 /100 | #291 | Tragic 90.3% |
| Cubans | 0.0 /100 | #292 | Tragic 90.2% |
| Natives/Alaskans | 0.0 /100 | #293 | Tragic 90.2% |
| Immigrants | Grenada | 0.0 /100 | #294 | Tragic 90.1% |
Demographics Similar to Latvians by 11th Grade
In terms of 11th grade, the demographic groups most similar to Latvians are Finnish (94.7%, a difference of 0.0%), German (94.7%, a difference of 0.0%), Chinese (94.6%, a difference of 0.030%), Danish (94.7%, a difference of 0.050%), and Croatian (94.7%, a difference of 0.090%).
| Demographics | Rating | Rank | 11th Grade |
| Carpatho Rusyns | 100.0 /100 | #5 | Exceptional 94.8% |
| Lithuanians | 100.0 /100 | #6 | Exceptional 94.8% |
| Poles | 100.0 /100 | #7 | Exceptional 94.8% |
| Croatians | 100.0 /100 | #8 | Exceptional 94.7% |
| Danes | 100.0 /100 | #9 | Exceptional 94.7% |
| Finns | 100.0 /100 | #10 | Exceptional 94.7% |
| Germans | 100.0 /100 | #11 | Exceptional 94.7% |
| Latvians | 100.0 /100 | #12 | Exceptional 94.7% |
| Chinese | 100.0 /100 | #13 | Exceptional 94.6% |
| Eastern Europeans | 100.0 /100 | #14 | Exceptional 94.6% |
| Bulgarians | 100.0 /100 | #15 | Exceptional 94.5% |
| Immigrants | India | 100.0 /100 | #16 | Exceptional 94.5% |
| Luxembourgers | 100.0 /100 | #17 | Exceptional 94.5% |
| Maltese | 100.0 /100 | #18 | Exceptional 94.5% |
| Scandinavians | 100.0 /100 | #19 | Exceptional 94.5% |