Apache vs South American 11th Grade
COMPARE
Apache
South American
11th Grade
11th Grade Comparison
Apache
South Americans
90.4%
11TH GRADE
0.0/ 100
METRIC RATING
287th/ 347
METRIC RANK
91.6%
11TH GRADE
2.0/ 100
METRIC RATING
240th/ 347
METRIC RANK
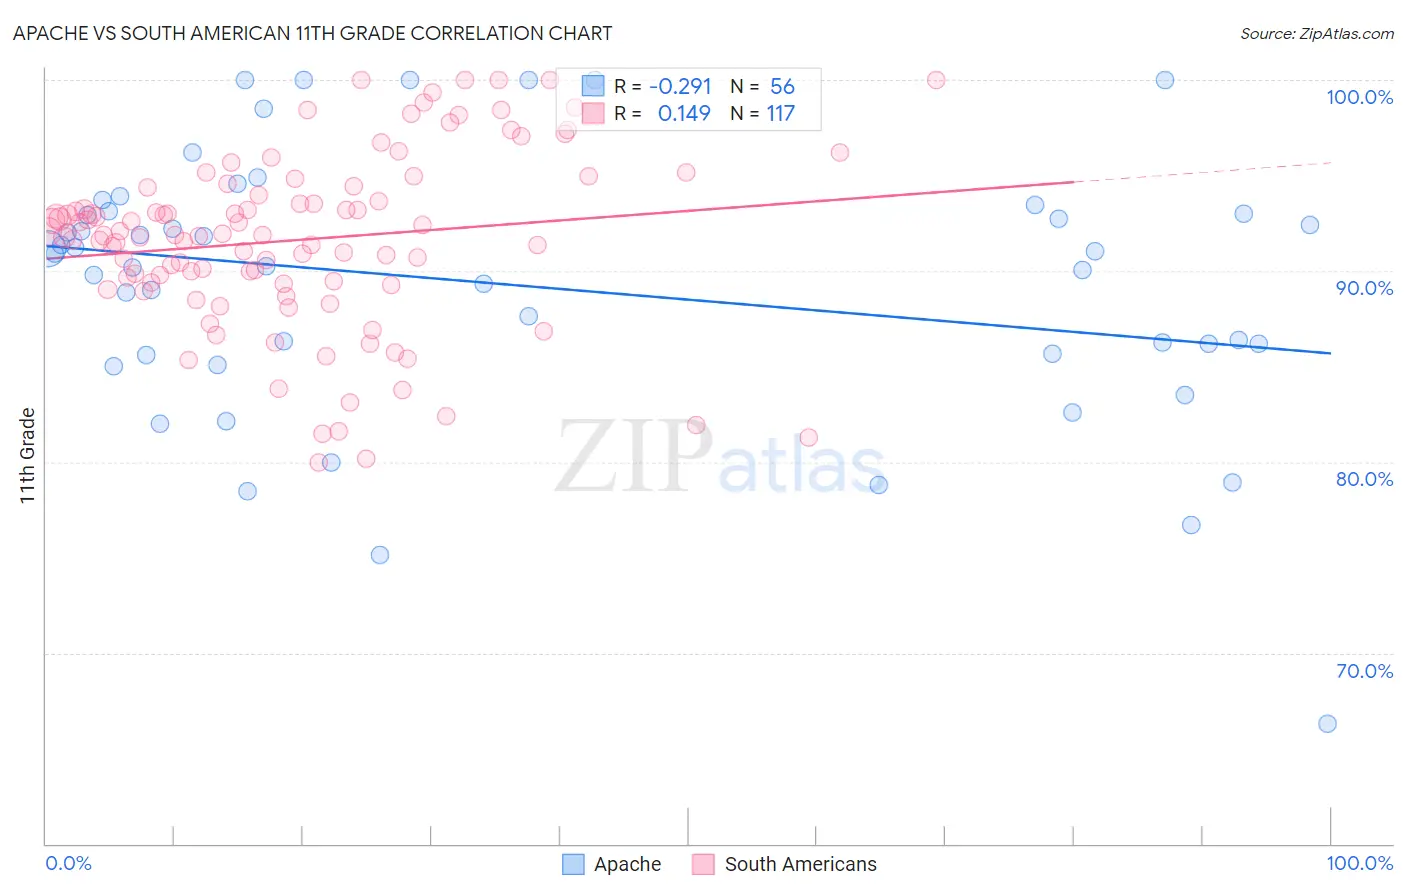
Apache vs South American 11th Grade Correlation Chart
The statistical analysis conducted on geographies consisting of 231,143,094 people shows a weak negative correlation between the proportion of Apache and percentage of population with at least 11th grade education in the United States with a correlation coefficient (R) of -0.291 and weighted average of 90.4%. Similarly, the statistical analysis conducted on geographies consisting of 494,065,729 people shows a poor positive correlation between the proportion of South Americans and percentage of population with at least 11th grade education in the United States with a correlation coefficient (R) of 0.149 and weighted average of 91.6%, a difference of 1.4%.
11th Grade Correlation Summary
| Measurement | Apache | South American |
| Minimum | 66.3% | 80.0% |
| Maximum | 100.0% | 100.0% |
| Range | 33.7% | 20.0% |
| Mean | 89.2% | 91.6% |
| Median | 90.6% | 91.9% |
| Interquartile 25% (IQ1) | 85.6% | 89.4% |
| Interquartile 75% (IQ3) | 93.1% | 94.4% |
| Interquartile Range (IQR) | 7.4% | 5.0% |
| Standard Deviation (Sample) | 7.0% | 4.6% |
| Standard Deviation (Population) | 6.9% | 4.6% |
Similar Demographics by 11th Grade
Demographics Similar to Apache by 11th Grade
In terms of 11th grade, the demographic groups most similar to Apache are Immigrants from West Indies (90.4%, a difference of 0.010%), Pennsylvania German (90.3%, a difference of 0.020%), British West Indian (90.3%, a difference of 0.050%), Immigrants from Burma/Myanmar (90.4%, a difference of 0.060%), and Indonesian (90.3%, a difference of 0.070%).
| Demographics | Rating | Rank | 11th Grade |
| Sri Lankans | 0.0 /100 | #280 | Tragic 90.7% |
| Dutch West Indians | 0.0 /100 | #281 | Tragic 90.7% |
| Immigrants | St. Vincent and the Grenadines | 0.0 /100 | #282 | Tragic 90.7% |
| Immigrants | Barbados | 0.0 /100 | #283 | Tragic 90.7% |
| Immigrants | Laos | 0.0 /100 | #284 | Tragic 90.5% |
| Immigrants | Burma/Myanmar | 0.0 /100 | #285 | Tragic 90.4% |
| Immigrants | West Indies | 0.0 /100 | #286 | Tragic 90.4% |
| Apache | 0.0 /100 | #287 | Tragic 90.4% |
| Pennsylvania Germans | 0.0 /100 | #288 | Tragic 90.3% |
| British West Indians | 0.0 /100 | #289 | Tragic 90.3% |
| Indonesians | 0.0 /100 | #290 | Tragic 90.3% |
| Haitians | 0.0 /100 | #291 | Tragic 90.3% |
| Cubans | 0.0 /100 | #292 | Tragic 90.2% |
| Natives/Alaskans | 0.0 /100 | #293 | Tragic 90.2% |
| Immigrants | Grenada | 0.0 /100 | #294 | Tragic 90.1% |
Demographics Similar to South Americans by 11th Grade
In terms of 11th grade, the demographic groups most similar to South Americans are Bahamian (91.6%, a difference of 0.020%), Immigrants from Middle Africa (91.6%, a difference of 0.050%), Hopi (91.7%, a difference of 0.060%), Comanche (91.7%, a difference of 0.070%), and Immigrants from Thailand (91.6%, a difference of 0.080%).
| Demographics | Rating | Rank | 11th Grade |
| Cheyenne | 3.3 /100 | #233 | Tragic 91.8% |
| Armenians | 2.9 /100 | #234 | Tragic 91.7% |
| Sub-Saharan Africans | 2.9 /100 | #235 | Tragic 91.7% |
| Colombians | 2.8 /100 | #236 | Tragic 91.7% |
| Immigrants | Bolivia | 2.8 /100 | #237 | Tragic 91.7% |
| Comanche | 2.6 /100 | #238 | Tragic 91.7% |
| Hopi | 2.5 /100 | #239 | Tragic 91.7% |
| South Americans | 2.0 /100 | #240 | Tragic 91.6% |
| Bahamians | 1.8 /100 | #241 | Tragic 91.6% |
| Immigrants | Middle Africa | 1.6 /100 | #242 | Tragic 91.6% |
| Immigrants | Thailand | 1.4 /100 | #243 | Tragic 91.6% |
| Senegalese | 1.4 /100 | #244 | Tragic 91.6% |
| Africans | 1.3 /100 | #245 | Tragic 91.5% |
| Seminole | 1.2 /100 | #246 | Tragic 91.5% |
| Immigrants | Philippines | 1.0 /100 | #247 | Tragic 91.5% |