Albanian vs Latvian 11th Grade
COMPARE
Albanian
Latvian
11th Grade
11th Grade Comparison
Albanians
Latvians
93.0%
11TH GRADE
89.5/ 100
METRIC RATING
130th/ 347
METRIC RANK
94.7%
11TH GRADE
100.0/ 100
METRIC RATING
12th/ 347
METRIC RANK
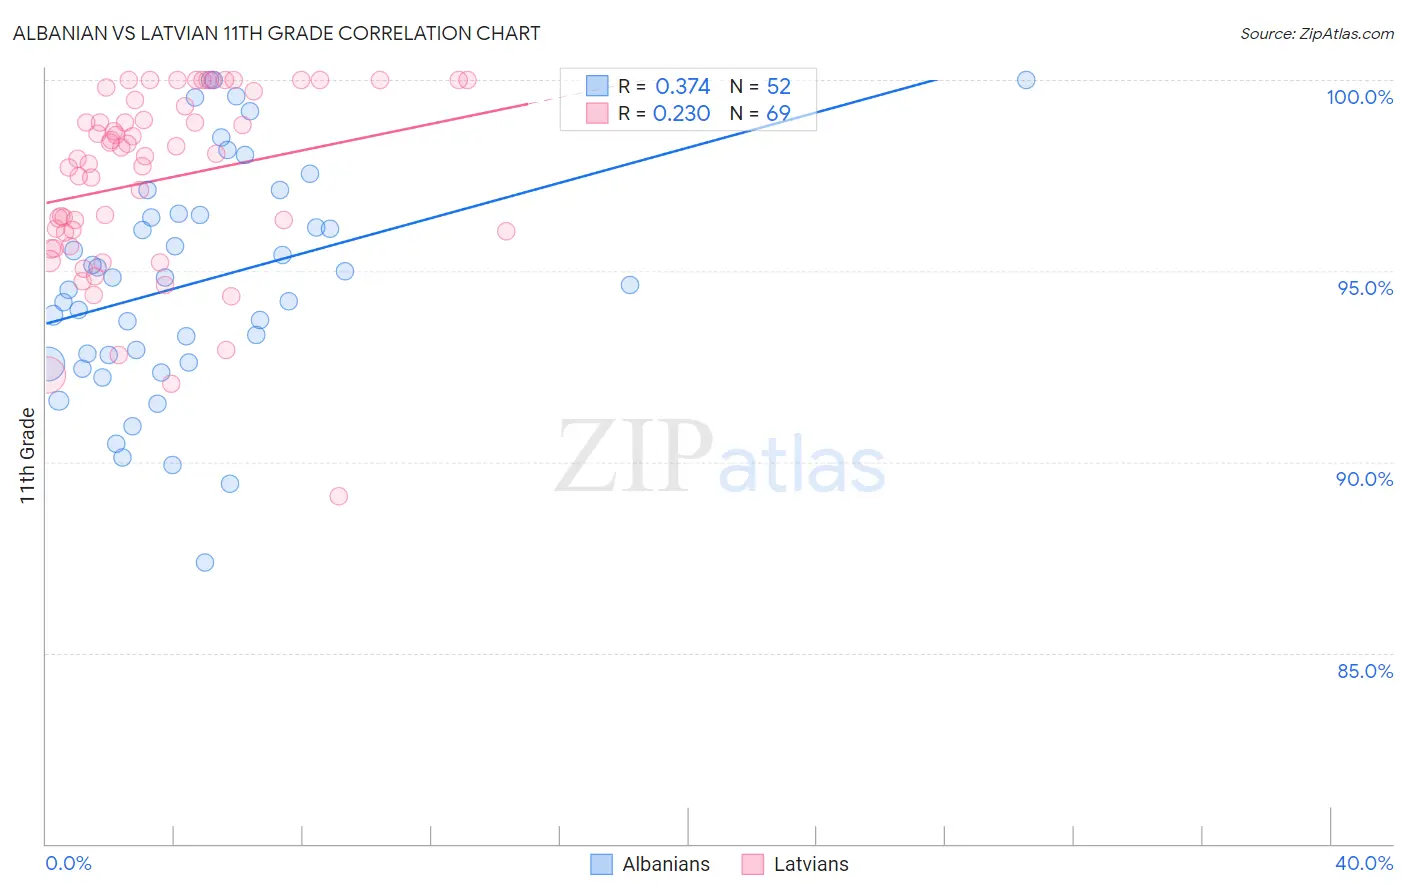
Albanian vs Latvian 11th Grade Correlation Chart
The statistical analysis conducted on geographies consisting of 193,265,850 people shows a mild positive correlation between the proportion of Albanians and percentage of population with at least 11th grade education in the United States with a correlation coefficient (R) of 0.374 and weighted average of 93.0%. Similarly, the statistical analysis conducted on geographies consisting of 220,726,252 people shows a weak positive correlation between the proportion of Latvians and percentage of population with at least 11th grade education in the United States with a correlation coefficient (R) of 0.230 and weighted average of 94.7%, a difference of 1.8%.
11th Grade Correlation Summary
| Measurement | Albanian | Latvian |
| Minimum | 87.4% | 89.1% |
| Maximum | 100.0% | 100.0% |
| Range | 12.6% | 10.9% |
| Mean | 94.7% | 97.4% |
| Median | 94.7% | 98.0% |
| Interquartile 25% (IQ1) | 92.7% | 95.8% |
| Interquartile 75% (IQ3) | 96.5% | 99.4% |
| Interquartile Range (IQR) | 3.8% | 3.6% |
| Standard Deviation (Sample) | 3.0% | 2.4% |
| Standard Deviation (Population) | 2.9% | 2.4% |
Similar Demographics by 11th Grade
Demographics Similar to Albanians by 11th Grade
In terms of 11th grade, the demographic groups most similar to Albanians are Egyptian (93.0%, a difference of 0.0%), Immigrants from Ukraine (93.0%, a difference of 0.010%), Immigrants from Bosnia and Herzegovina (93.0%, a difference of 0.010%), Mongolian (93.0%, a difference of 0.050%), and Delaware (93.0%, a difference of 0.050%).
| Demographics | Rating | Rank | 11th Grade |
| Immigrants | Greece | 95.9 /100 | #123 | Exceptional 93.2% |
| Immigrants | Eastern Europe | 95.9 /100 | #124 | Exceptional 93.2% |
| Immigrants | Sri Lanka | 95.6 /100 | #125 | Exceptional 93.2% |
| Basques | 95.2 /100 | #126 | Exceptional 93.2% |
| Immigrants | Kazakhstan | 92.4 /100 | #127 | Exceptional 93.1% |
| Immigrants | Jordan | 92.4 /100 | #128 | Exceptional 93.1% |
| Immigrants | Ukraine | 89.8 /100 | #129 | Excellent 93.0% |
| Albanians | 89.5 /100 | #130 | Excellent 93.0% |
| Egyptians | 89.5 /100 | #131 | Excellent 93.0% |
| Immigrants | Bosnia and Herzegovina | 89.0 /100 | #132 | Excellent 93.0% |
| Mongolians | 87.6 /100 | #133 | Excellent 93.0% |
| Delaware | 87.3 /100 | #134 | Excellent 93.0% |
| Immigrants | Italy | 86.6 /100 | #135 | Excellent 92.9% |
| Cree | 85.9 /100 | #136 | Excellent 92.9% |
| Arabs | 85.4 /100 | #137 | Excellent 92.9% |
Demographics Similar to Latvians by 11th Grade
In terms of 11th grade, the demographic groups most similar to Latvians are Finnish (94.7%, a difference of 0.0%), German (94.7%, a difference of 0.0%), Chinese (94.6%, a difference of 0.030%), Danish (94.7%, a difference of 0.050%), and Croatian (94.7%, a difference of 0.090%).
| Demographics | Rating | Rank | 11th Grade |
| Carpatho Rusyns | 100.0 /100 | #5 | Exceptional 94.8% |
| Lithuanians | 100.0 /100 | #6 | Exceptional 94.8% |
| Poles | 100.0 /100 | #7 | Exceptional 94.8% |
| Croatians | 100.0 /100 | #8 | Exceptional 94.7% |
| Danes | 100.0 /100 | #9 | Exceptional 94.7% |
| Finns | 100.0 /100 | #10 | Exceptional 94.7% |
| Germans | 100.0 /100 | #11 | Exceptional 94.7% |
| Latvians | 100.0 /100 | #12 | Exceptional 94.7% |
| Chinese | 100.0 /100 | #13 | Exceptional 94.6% |
| Eastern Europeans | 100.0 /100 | #14 | Exceptional 94.6% |
| Bulgarians | 100.0 /100 | #15 | Exceptional 94.5% |
| Immigrants | India | 100.0 /100 | #16 | Exceptional 94.5% |
| Luxembourgers | 100.0 /100 | #17 | Exceptional 94.5% |
| Maltese | 100.0 /100 | #18 | Exceptional 94.5% |
| Scandinavians | 100.0 /100 | #19 | Exceptional 94.5% |