Nicaraguan vs Latvian 11th Grade
COMPARE
Nicaraguan
Latvian
11th Grade
11th Grade Comparison
Nicaraguans
Latvians
88.9%
11TH GRADE
0.0/ 100
METRIC RATING
318th/ 347
METRIC RANK
94.7%
11TH GRADE
100.0/ 100
METRIC RATING
12th/ 347
METRIC RANK
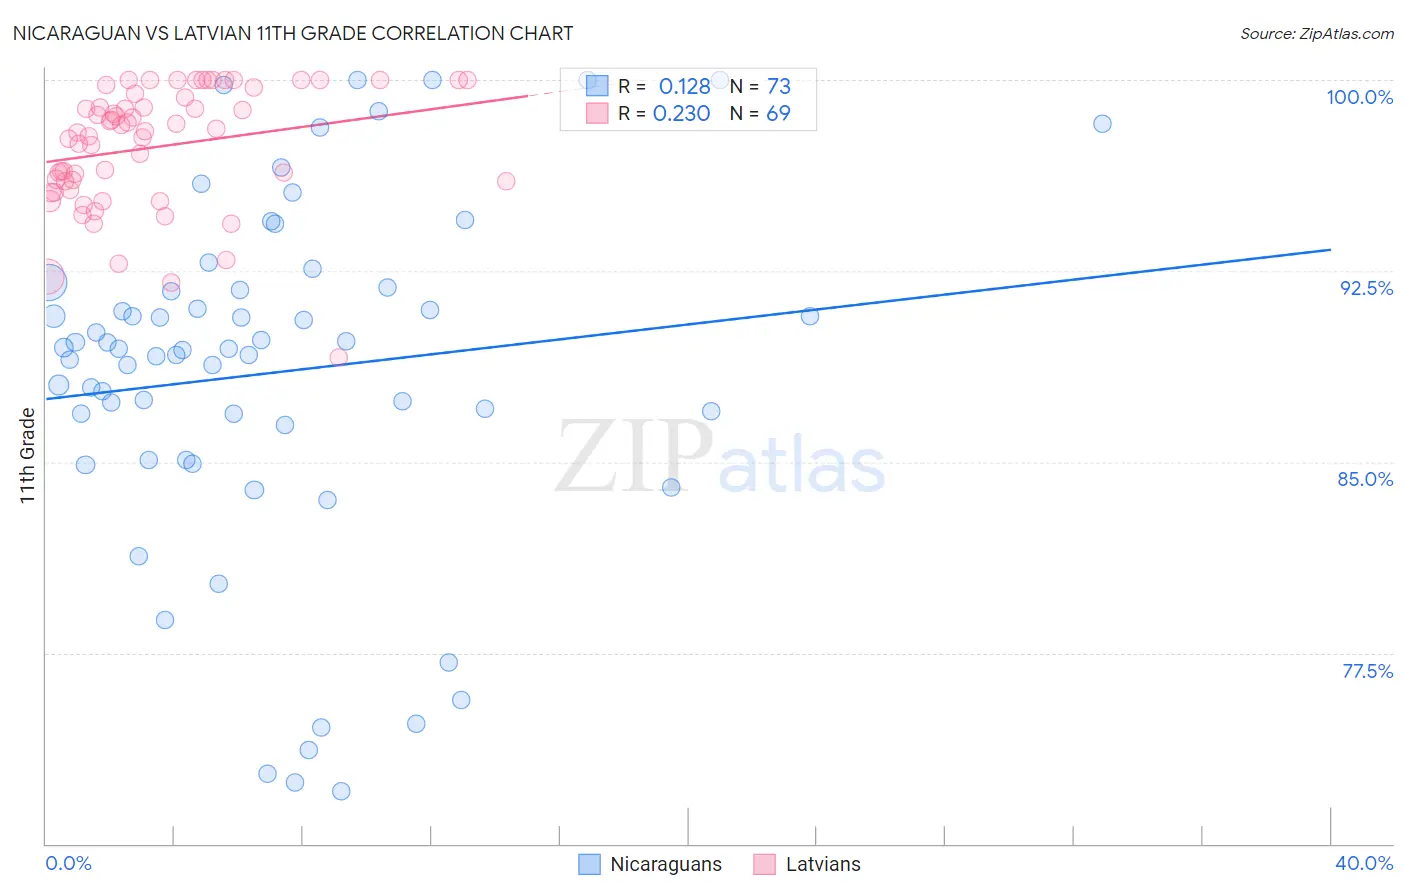
Nicaraguan vs Latvian 11th Grade Correlation Chart
The statistical analysis conducted on geographies consisting of 285,711,651 people shows a poor positive correlation between the proportion of Nicaraguans and percentage of population with at least 11th grade education in the United States with a correlation coefficient (R) of 0.128 and weighted average of 88.9%. Similarly, the statistical analysis conducted on geographies consisting of 220,726,252 people shows a weak positive correlation between the proportion of Latvians and percentage of population with at least 11th grade education in the United States with a correlation coefficient (R) of 0.230 and weighted average of 94.7%, a difference of 6.5%.
11th Grade Correlation Summary
| Measurement | Nicaraguan | Latvian |
| Minimum | 72.0% | 89.1% |
| Maximum | 100.0% | 100.0% |
| Range | 28.0% | 10.9% |
| Mean | 88.5% | 97.4% |
| Median | 89.5% | 98.0% |
| Interquartile 25% (IQ1) | 85.8% | 95.8% |
| Interquartile 75% (IQ3) | 91.8% | 99.4% |
| Interquartile Range (IQR) | 6.0% | 3.6% |
| Standard Deviation (Sample) | 6.9% | 2.4% |
| Standard Deviation (Population) | 6.8% | 2.4% |
Similar Demographics by 11th Grade
Demographics Similar to Nicaraguans by 11th Grade
In terms of 11th grade, the demographic groups most similar to Nicaraguans are Lumbee (88.9%, a difference of 0.060%), Immigrants from Cuba (88.9%, a difference of 0.070%), Belizean (88.8%, a difference of 0.090%), Immigrants from Armenia (88.8%, a difference of 0.11%), and Immigrants from Belize (88.7%, a difference of 0.20%).
| Demographics | Rating | Rank | 11th Grade |
| Vietnamese | 0.0 /100 | #311 | Tragic 89.4% |
| Immigrants | Portugal | 0.0 /100 | #312 | Tragic 89.3% |
| Immigrants | Caribbean | 0.0 /100 | #313 | Tragic 89.1% |
| Cape Verdeans | 0.0 /100 | #314 | Tragic 89.1% |
| Immigrants | Ecuador | 0.0 /100 | #315 | Tragic 89.1% |
| Immigrants | Cuba | 0.0 /100 | #316 | Tragic 88.9% |
| Lumbee | 0.0 /100 | #317 | Tragic 88.9% |
| Nicaraguans | 0.0 /100 | #318 | Tragic 88.9% |
| Belizeans | 0.0 /100 | #319 | Tragic 88.8% |
| Immigrants | Armenia | 0.0 /100 | #320 | Tragic 88.8% |
| Immigrants | Belize | 0.0 /100 | #321 | Tragic 88.7% |
| Puerto Ricans | 0.0 /100 | #322 | Tragic 88.4% |
| Pima | 0.0 /100 | #323 | Tragic 88.3% |
| Central American Indians | 0.0 /100 | #324 | Tragic 88.2% |
| Immigrants | Nicaragua | 0.0 /100 | #325 | Tragic 88.1% |
Demographics Similar to Latvians by 11th Grade
In terms of 11th grade, the demographic groups most similar to Latvians are Finnish (94.7%, a difference of 0.0%), German (94.7%, a difference of 0.0%), Chinese (94.6%, a difference of 0.030%), Danish (94.7%, a difference of 0.050%), and Croatian (94.7%, a difference of 0.090%).
| Demographics | Rating | Rank | 11th Grade |
| Carpatho Rusyns | 100.0 /100 | #5 | Exceptional 94.8% |
| Lithuanians | 100.0 /100 | #6 | Exceptional 94.8% |
| Poles | 100.0 /100 | #7 | Exceptional 94.8% |
| Croatians | 100.0 /100 | #8 | Exceptional 94.7% |
| Danes | 100.0 /100 | #9 | Exceptional 94.7% |
| Finns | 100.0 /100 | #10 | Exceptional 94.7% |
| Germans | 100.0 /100 | #11 | Exceptional 94.7% |
| Latvians | 100.0 /100 | #12 | Exceptional 94.7% |
| Chinese | 100.0 /100 | #13 | Exceptional 94.6% |
| Eastern Europeans | 100.0 /100 | #14 | Exceptional 94.6% |
| Bulgarians | 100.0 /100 | #15 | Exceptional 94.5% |
| Immigrants | India | 100.0 /100 | #16 | Exceptional 94.5% |
| Luxembourgers | 100.0 /100 | #17 | Exceptional 94.5% |
| Maltese | 100.0 /100 | #18 | Exceptional 94.5% |
| Scandinavians | 100.0 /100 | #19 | Exceptional 94.5% |