Apache vs Cuban Nursery School
COMPARE
Apache
Cuban
Nursery School
Nursery School Comparison
Apache
Cubans
98.1%
NURSERY SCHOOL
73.2/ 100
METRIC RATING
149th/ 347
METRIC RANK
97.6%
NURSERY SCHOOL
0.4/ 100
METRIC RATING
261st/ 347
METRIC RANK
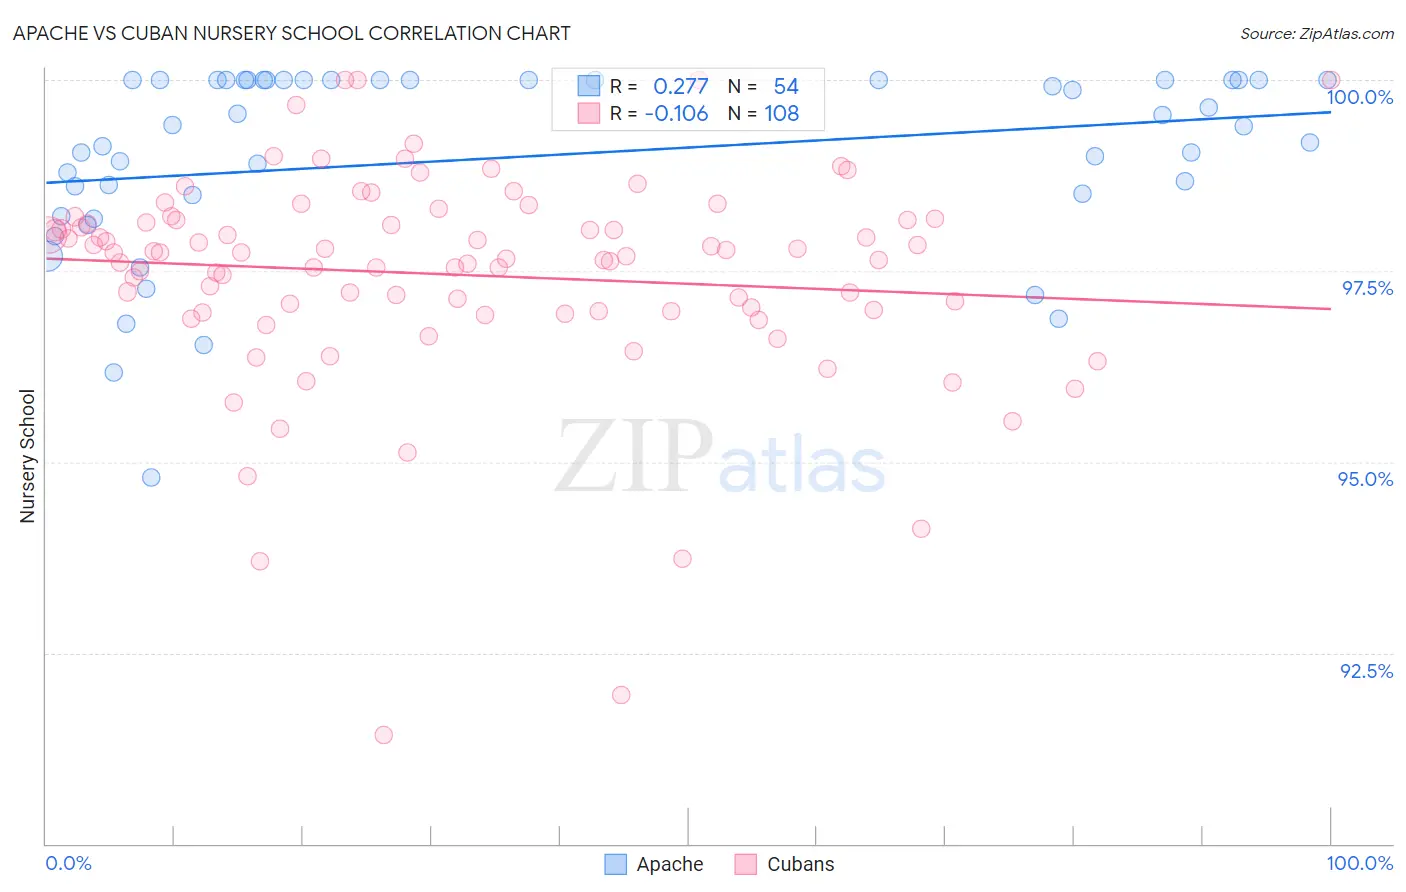
Apache vs Cuban Nursery School Correlation Chart
The statistical analysis conducted on geographies consisting of 231,142,814 people shows a weak positive correlation between the proportion of Apache and percentage of population with at least nursery school education in the United States with a correlation coefficient (R) of 0.277 and weighted average of 98.1%. Similarly, the statistical analysis conducted on geographies consisting of 449,326,865 people shows a poor negative correlation between the proportion of Cubans and percentage of population with at least nursery school education in the United States with a correlation coefficient (R) of -0.106 and weighted average of 97.6%, a difference of 0.49%.
Nursery School Correlation Summary
| Measurement | Apache | Cuban |
| Minimum | 94.8% | 91.4% |
| Maximum | 100.0% | 100.0% |
| Range | 5.2% | 8.6% |
| Mean | 99.0% | 97.5% |
| Median | 99.4% | 97.7% |
| Interquartile 25% (IQ1) | 98.5% | 97.0% |
| Interquartile 75% (IQ3) | 100.0% | 98.2% |
| Interquartile Range (IQR) | 1.5% | 1.2% |
| Standard Deviation (Sample) | 1.2% | 1.4% |
| Standard Deviation (Population) | 1.2% | 1.4% |
Similar Demographics by Nursery School
Demographics Similar to Apache by Nursery School
In terms of nursery school, the demographic groups most similar to Apache are Jordanian (98.1%, a difference of 0.0%), Hmong (98.1%, a difference of 0.010%), Immigrants from Greece (98.1%, a difference of 0.010%), Soviet Union (98.0%, a difference of 0.010%), and Dutch West Indian (98.0%, a difference of 0.010%).
| Demographics | Rating | Rank | Nursery School |
| Burmese | 81.7 /100 | #142 | Excellent 98.1% |
| Marshallese | 81.2 /100 | #143 | Excellent 98.1% |
| Alsatians | 80.3 /100 | #144 | Excellent 98.1% |
| Immigrants | Israel | 78.5 /100 | #145 | Good 98.1% |
| Filipinos | 78.5 /100 | #146 | Good 98.1% |
| Hmong | 75.7 /100 | #147 | Good 98.1% |
| Immigrants | Greece | 75.4 /100 | #148 | Good 98.1% |
| Apache | 73.2 /100 | #149 | Good 98.1% |
| Jordanians | 72.9 /100 | #150 | Good 98.1% |
| Soviet Union | 71.6 /100 | #151 | Good 98.0% |
| Dutch West Indians | 70.2 /100 | #152 | Good 98.0% |
| Immigrants | Moldova | 69.6 /100 | #153 | Good 98.0% |
| Immigrants | Iran | 68.7 /100 | #154 | Good 98.0% |
| Immigrants | South Central Asia | 66.7 /100 | #155 | Good 98.0% |
| Venezuelans | 66.6 /100 | #156 | Good 98.0% |
Demographics Similar to Cubans by Nursery School
In terms of nursery school, the demographic groups most similar to Cubans are Immigrants from South America (97.6%, a difference of 0.0%), Armenian (97.6%, a difference of 0.010%), Immigrants from Ethiopia (97.6%, a difference of 0.010%), Fijian (97.6%, a difference of 0.010%), and Taiwanese (97.6%, a difference of 0.010%).
| Demographics | Rating | Rank | Nursery School |
| Immigrants | Congo | 0.7 /100 | #254 | Tragic 97.6% |
| Immigrants | Asia | 0.7 /100 | #255 | Tragic 97.6% |
| Yaqui | 0.6 /100 | #256 | Tragic 97.6% |
| Immigrants | Colombia | 0.6 /100 | #257 | Tragic 97.6% |
| Jamaicans | 0.6 /100 | #258 | Tragic 97.6% |
| Armenians | 0.4 /100 | #259 | Tragic 97.6% |
| Immigrants | South America | 0.4 /100 | #260 | Tragic 97.6% |
| Cubans | 0.4 /100 | #261 | Tragic 97.6% |
| Immigrants | Ethiopia | 0.4 /100 | #262 | Tragic 97.6% |
| Fijians | 0.3 /100 | #263 | Tragic 97.6% |
| Taiwanese | 0.3 /100 | #264 | Tragic 97.6% |
| Assyrians/Chaldeans/Syriacs | 0.3 /100 | #265 | Tragic 97.6% |
| Immigrants | Sierra Leone | 0.3 /100 | #266 | Tragic 97.6% |
| Immigrants | Nigeria | 0.3 /100 | #267 | Tragic 97.5% |
| West Indians | 0.3 /100 | #268 | Tragic 97.5% |