Apache vs Luxembourger Nursery School
COMPARE
Apache
Luxembourger
Nursery School
Nursery School Comparison
Apache
Luxembourgers
98.1%
NURSERY SCHOOL
73.2/ 100
METRIC RATING
149th/ 347
METRIC RANK
98.5%
NURSERY SCHOOL
99.9/ 100
METRIC RATING
41st/ 347
METRIC RANK
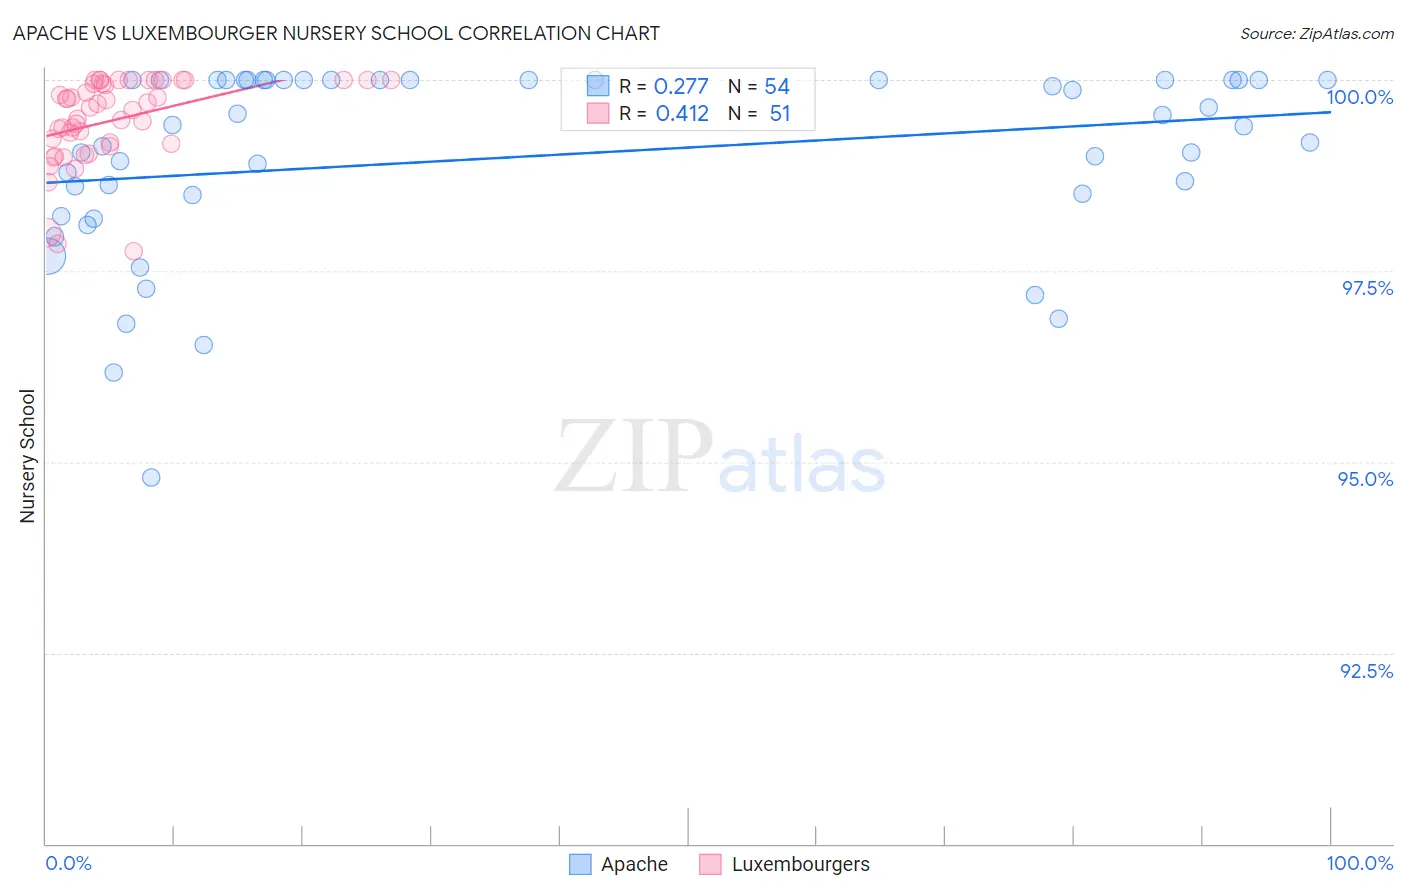
Apache vs Luxembourger Nursery School Correlation Chart
The statistical analysis conducted on geographies consisting of 231,142,814 people shows a weak positive correlation between the proportion of Apache and percentage of population with at least nursery school education in the United States with a correlation coefficient (R) of 0.277 and weighted average of 98.1%. Similarly, the statistical analysis conducted on geographies consisting of 144,675,804 people shows a moderate positive correlation between the proportion of Luxembourgers and percentage of population with at least nursery school education in the United States with a correlation coefficient (R) of 0.412 and weighted average of 98.5%, a difference of 0.46%.
Nursery School Correlation Summary
| Measurement | Apache | Luxembourger |
| Minimum | 94.8% | 97.8% |
| Maximum | 100.0% | 100.0% |
| Range | 5.2% | 2.2% |
| Mean | 99.0% | 99.5% |
| Median | 99.4% | 99.6% |
| Interquartile 25% (IQ1) | 98.5% | 99.2% |
| Interquartile 75% (IQ3) | 100.0% | 100.0% |
| Interquartile Range (IQR) | 1.5% | 0.83% |
| Standard Deviation (Sample) | 1.2% | 0.56% |
| Standard Deviation (Population) | 1.2% | 0.56% |
Similar Demographics by Nursery School
Demographics Similar to Apache by Nursery School
In terms of nursery school, the demographic groups most similar to Apache are Jordanian (98.1%, a difference of 0.0%), Hmong (98.1%, a difference of 0.010%), Immigrants from Greece (98.1%, a difference of 0.010%), Soviet Union (98.0%, a difference of 0.010%), and Dutch West Indian (98.0%, a difference of 0.010%).
| Demographics | Rating | Rank | Nursery School |
| Burmese | 81.7 /100 | #142 | Excellent 98.1% |
| Marshallese | 81.2 /100 | #143 | Excellent 98.1% |
| Alsatians | 80.3 /100 | #144 | Excellent 98.1% |
| Immigrants | Israel | 78.5 /100 | #145 | Good 98.1% |
| Filipinos | 78.5 /100 | #146 | Good 98.1% |
| Hmong | 75.7 /100 | #147 | Good 98.1% |
| Immigrants | Greece | 75.4 /100 | #148 | Good 98.1% |
| Apache | 73.2 /100 | #149 | Good 98.1% |
| Jordanians | 72.9 /100 | #150 | Good 98.1% |
| Soviet Union | 71.6 /100 | #151 | Good 98.0% |
| Dutch West Indians | 70.2 /100 | #152 | Good 98.0% |
| Immigrants | Moldova | 69.6 /100 | #153 | Good 98.0% |
| Immigrants | Iran | 68.7 /100 | #154 | Good 98.0% |
| Immigrants | South Central Asia | 66.7 /100 | #155 | Good 98.0% |
| Venezuelans | 66.6 /100 | #156 | Good 98.0% |
Demographics Similar to Luxembourgers by Nursery School
In terms of nursery school, the demographic groups most similar to Luxembourgers are Eastern European (98.5%, a difference of 0.0%), Latvian (98.5%, a difference of 0.010%), Chippewa (98.5%, a difference of 0.010%), Native Hawaiian (98.5%, a difference of 0.010%), and Belgian (98.5%, a difference of 0.010%).
| Demographics | Rating | Rank | Nursery School |
| Chinese | 100.0 /100 | #34 | Exceptional 98.6% |
| Swiss | 100.0 /100 | #35 | Exceptional 98.6% |
| British | 100.0 /100 | #36 | Exceptional 98.5% |
| Lumbee | 99.9 /100 | #37 | Exceptional 98.5% |
| Italians | 99.9 /100 | #38 | Exceptional 98.5% |
| Latvians | 99.9 /100 | #39 | Exceptional 98.5% |
| Chippewa | 99.9 /100 | #40 | Exceptional 98.5% |
| Luxembourgers | 99.9 /100 | #41 | Exceptional 98.5% |
| Eastern Europeans | 99.9 /100 | #42 | Exceptional 98.5% |
| Native Hawaiians | 99.9 /100 | #43 | Exceptional 98.5% |
| Belgians | 99.9 /100 | #44 | Exceptional 98.5% |
| Northern Europeans | 99.9 /100 | #45 | Exceptional 98.5% |
| Hungarians | 99.9 /100 | #46 | Exceptional 98.5% |
| Czechoslovakians | 99.9 /100 | #47 | Exceptional 98.5% |
| Ottawa | 99.8 /100 | #48 | Exceptional 98.5% |