Immigrants from Bulgaria vs Cuban Nursery School
COMPARE
Immigrants from Bulgaria
Cuban
Nursery School
Nursery School Comparison
Immigrants from Bulgaria
Cubans
98.1%
NURSERY SCHOOL
89.4/ 100
METRIC RATING
134th/ 347
METRIC RANK
97.6%
NURSERY SCHOOL
0.4/ 100
METRIC RATING
261st/ 347
METRIC RANK
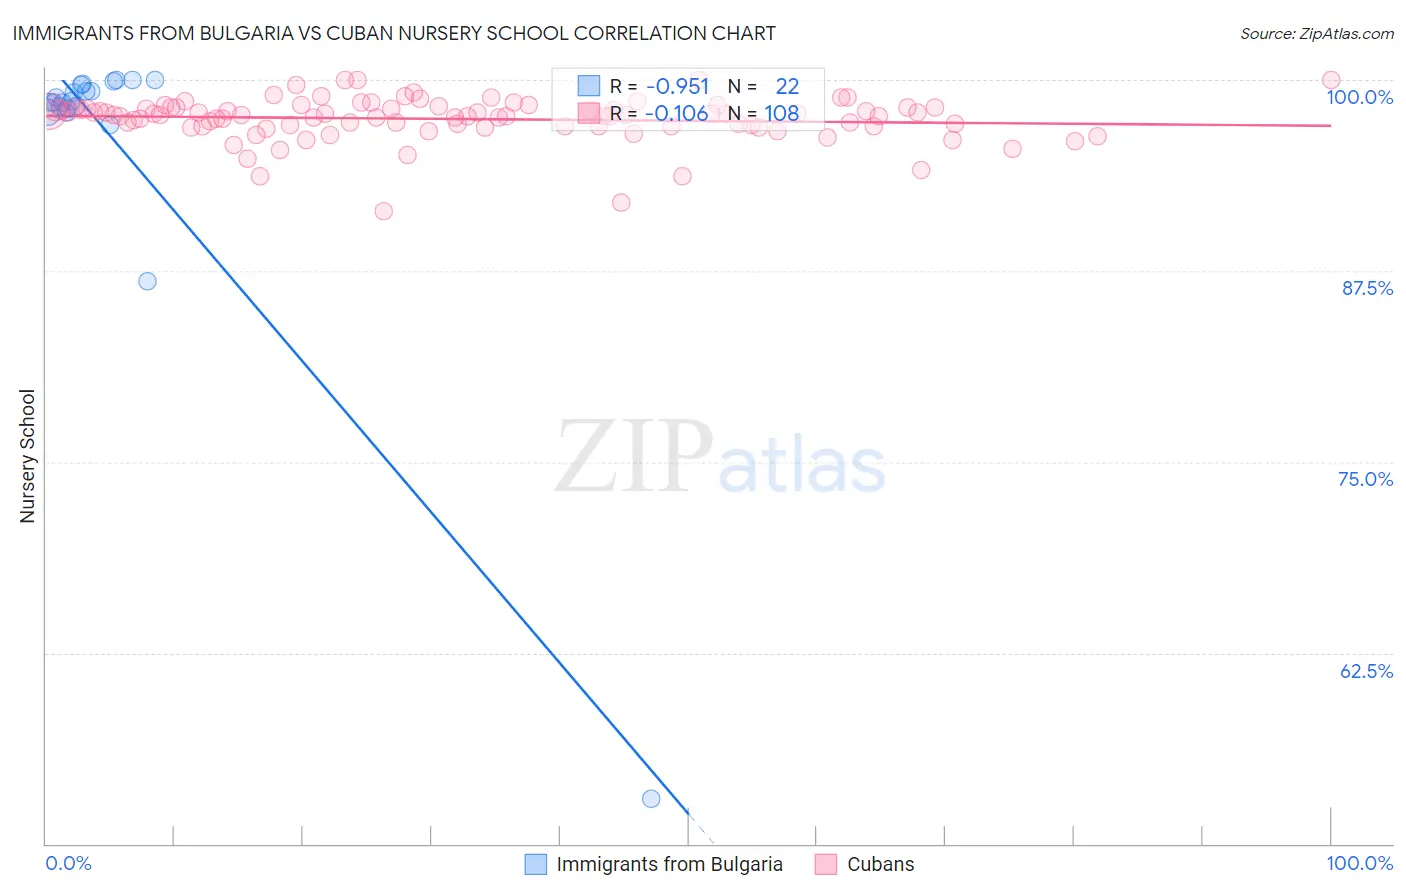
Immigrants from Bulgaria vs Cuban Nursery School Correlation Chart
The statistical analysis conducted on geographies consisting of 172,552,181 people shows a perfect negative correlation between the proportion of Immigrants from Bulgaria and percentage of population with at least nursery school education in the United States with a correlation coefficient (R) of -0.951 and weighted average of 98.1%. Similarly, the statistical analysis conducted on geographies consisting of 449,326,865 people shows a poor negative correlation between the proportion of Cubans and percentage of population with at least nursery school education in the United States with a correlation coefficient (R) of -0.106 and weighted average of 97.6%, a difference of 0.58%.
Nursery School Correlation Summary
| Measurement | Immigrants from Bulgaria | Cuban |
| Minimum | 52.9% | 91.4% |
| Maximum | 100.0% | 100.0% |
| Range | 47.1% | 8.6% |
| Mean | 96.2% | 97.5% |
| Median | 98.6% | 97.7% |
| Interquartile 25% (IQ1) | 98.2% | 97.0% |
| Interquartile 75% (IQ3) | 99.7% | 98.2% |
| Interquartile Range (IQR) | 1.5% | 1.2% |
| Standard Deviation (Sample) | 10.0% | 1.4% |
| Standard Deviation (Population) | 9.8% | 1.4% |
Similar Demographics by Nursery School
Demographics Similar to Immigrants from Bulgaria by Nursery School
In terms of nursery school, the demographic groups most similar to Immigrants from Bulgaria are Immigrants from Hungary (98.1%, a difference of 0.0%), Immigrants from Kuwait (98.1%, a difference of 0.0%), Spaniard (98.2%, a difference of 0.010%), Seminole (98.2%, a difference of 0.010%), and Immigrants from Europe (98.1%, a difference of 0.010%).
| Demographics | Rating | Rank | Nursery School |
| Immigrants | Saudi Arabia | 93.4 /100 | #127 | Exceptional 98.2% |
| Immigrants | Serbia | 92.4 /100 | #128 | Exceptional 98.2% |
| Cambodians | 91.4 /100 | #129 | Exceptional 98.2% |
| Immigrants | Croatia | 91.4 /100 | #130 | Exceptional 98.2% |
| Spaniards | 91.1 /100 | #131 | Exceptional 98.2% |
| Seminole | 90.9 /100 | #132 | Exceptional 98.2% |
| Immigrants | Europe | 90.7 /100 | #133 | Exceptional 98.1% |
| Immigrants | Bulgaria | 89.4 /100 | #134 | Excellent 98.1% |
| Immigrants | Hungary | 89.3 /100 | #135 | Excellent 98.1% |
| Immigrants | Kuwait | 88.9 /100 | #136 | Excellent 98.1% |
| Israelis | 88.2 /100 | #137 | Excellent 98.1% |
| Immigrants | Romania | 88.0 /100 | #138 | Excellent 98.1% |
| Blackfeet | 87.5 /100 | #139 | Excellent 98.1% |
| Palestinians | 83.7 /100 | #140 | Excellent 98.1% |
| Immigrants | Turkey | 83.0 /100 | #141 | Excellent 98.1% |
Demographics Similar to Cubans by Nursery School
In terms of nursery school, the demographic groups most similar to Cubans are Immigrants from South America (97.6%, a difference of 0.0%), Armenian (97.6%, a difference of 0.010%), Immigrants from Ethiopia (97.6%, a difference of 0.010%), Fijian (97.6%, a difference of 0.010%), and Taiwanese (97.6%, a difference of 0.010%).
| Demographics | Rating | Rank | Nursery School |
| Immigrants | Congo | 0.7 /100 | #254 | Tragic 97.6% |
| Immigrants | Asia | 0.7 /100 | #255 | Tragic 97.6% |
| Yaqui | 0.6 /100 | #256 | Tragic 97.6% |
| Immigrants | Colombia | 0.6 /100 | #257 | Tragic 97.6% |
| Jamaicans | 0.6 /100 | #258 | Tragic 97.6% |
| Armenians | 0.4 /100 | #259 | Tragic 97.6% |
| Immigrants | South America | 0.4 /100 | #260 | Tragic 97.6% |
| Cubans | 0.4 /100 | #261 | Tragic 97.6% |
| Immigrants | Ethiopia | 0.4 /100 | #262 | Tragic 97.6% |
| Fijians | 0.3 /100 | #263 | Tragic 97.6% |
| Taiwanese | 0.3 /100 | #264 | Tragic 97.6% |
| Assyrians/Chaldeans/Syriacs | 0.3 /100 | #265 | Tragic 97.6% |
| Immigrants | Sierra Leone | 0.3 /100 | #266 | Tragic 97.6% |
| Immigrants | Nigeria | 0.3 /100 | #267 | Tragic 97.5% |
| West Indians | 0.3 /100 | #268 | Tragic 97.5% |