Belizean vs Cuban Nursery School
COMPARE
Belizean
Cuban
Nursery School
Nursery School Comparison
Belizeans
Cubans
97.0%
NURSERY SCHOOL
0.0/ 100
METRIC RATING
306th/ 347
METRIC RANK
97.6%
NURSERY SCHOOL
0.4/ 100
METRIC RATING
261st/ 347
METRIC RANK
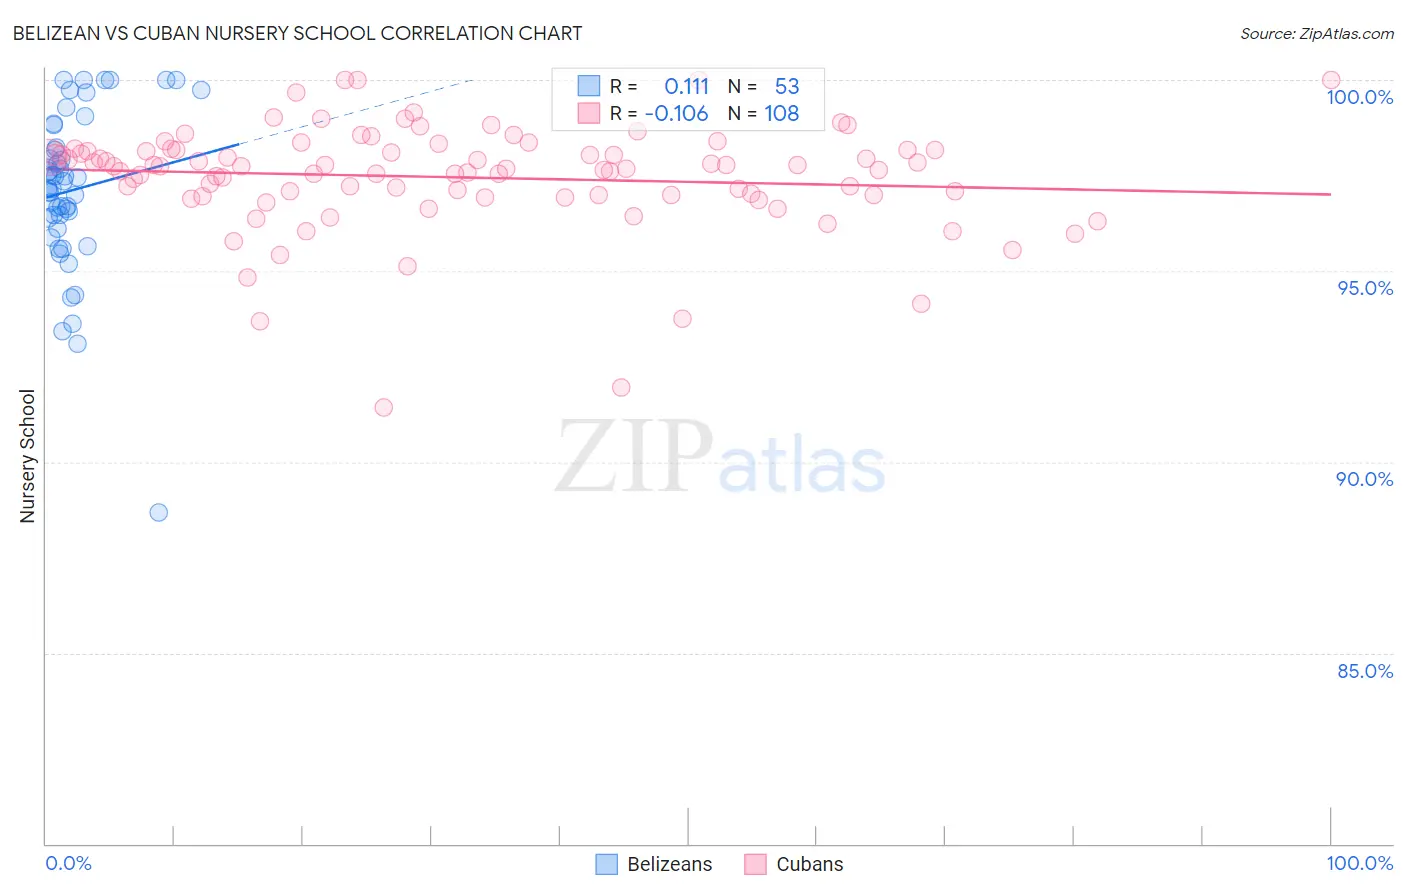
Belizean vs Cuban Nursery School Correlation Chart
The statistical analysis conducted on geographies consisting of 144,224,236 people shows a poor positive correlation between the proportion of Belizeans and percentage of population with at least nursery school education in the United States with a correlation coefficient (R) of 0.111 and weighted average of 97.0%. Similarly, the statistical analysis conducted on geographies consisting of 449,326,865 people shows a poor negative correlation between the proportion of Cubans and percentage of population with at least nursery school education in the United States with a correlation coefficient (R) of -0.106 and weighted average of 97.6%, a difference of 0.58%.
Nursery School Correlation Summary
| Measurement | Belizean | Cuban |
| Minimum | 88.7% | 91.4% |
| Maximum | 100.0% | 100.0% |
| Range | 11.3% | 8.6% |
| Mean | 97.1% | 97.5% |
| Median | 97.2% | 97.7% |
| Interquartile 25% (IQ1) | 96.3% | 97.0% |
| Interquartile 75% (IQ3) | 98.5% | 98.2% |
| Interquartile Range (IQR) | 2.3% | 1.2% |
| Standard Deviation (Sample) | 2.1% | 1.4% |
| Standard Deviation (Population) | 2.1% | 1.4% |
Similar Demographics by Nursery School
Demographics Similar to Belizeans by Nursery School
In terms of nursery school, the demographic groups most similar to Belizeans are Hispanic or Latino (97.0%, a difference of 0.010%), Immigrants from Haiti (97.0%, a difference of 0.010%), Immigrants from Somalia (97.0%, a difference of 0.020%), Guyanese (97.0%, a difference of 0.030%), and Immigrants from the Azores (97.0%, a difference of 0.030%).
| Demographics | Rating | Rank | Nursery School |
| Immigrants | Dominica | 0.0 /100 | #299 | Tragic 97.2% |
| Haitians | 0.0 /100 | #300 | Tragic 97.2% |
| Immigrants | South Eastern Asia | 0.0 /100 | #301 | Tragic 97.1% |
| Immigrants | Caribbean | 0.0 /100 | #302 | Tragic 97.1% |
| Nicaraguans | 0.0 /100 | #303 | Tragic 97.1% |
| Ecuadorians | 0.0 /100 | #304 | Tragic 97.1% |
| Somalis | 0.0 /100 | #305 | Tragic 97.1% |
| Belizeans | 0.0 /100 | #306 | Tragic 97.0% |
| Hispanics or Latinos | 0.0 /100 | #307 | Tragic 97.0% |
| Immigrants | Haiti | 0.0 /100 | #308 | Tragic 97.0% |
| Immigrants | Somalia | 0.0 /100 | #309 | Tragic 97.0% |
| Guyanese | 0.0 /100 | #310 | Tragic 97.0% |
| Immigrants | Azores | 0.0 /100 | #311 | Tragic 97.0% |
| Sri Lankans | 0.0 /100 | #312 | Tragic 97.0% |
| Hondurans | 0.0 /100 | #313 | Tragic 97.0% |
Demographics Similar to Cubans by Nursery School
In terms of nursery school, the demographic groups most similar to Cubans are Immigrants from South America (97.6%, a difference of 0.0%), Armenian (97.6%, a difference of 0.010%), Immigrants from Ethiopia (97.6%, a difference of 0.010%), Fijian (97.6%, a difference of 0.010%), and Taiwanese (97.6%, a difference of 0.010%).
| Demographics | Rating | Rank | Nursery School |
| Immigrants | Congo | 0.7 /100 | #254 | Tragic 97.6% |
| Immigrants | Asia | 0.7 /100 | #255 | Tragic 97.6% |
| Yaqui | 0.6 /100 | #256 | Tragic 97.6% |
| Immigrants | Colombia | 0.6 /100 | #257 | Tragic 97.6% |
| Jamaicans | 0.6 /100 | #258 | Tragic 97.6% |
| Armenians | 0.4 /100 | #259 | Tragic 97.6% |
| Immigrants | South America | 0.4 /100 | #260 | Tragic 97.6% |
| Cubans | 0.4 /100 | #261 | Tragic 97.6% |
| Immigrants | Ethiopia | 0.4 /100 | #262 | Tragic 97.6% |
| Fijians | 0.3 /100 | #263 | Tragic 97.6% |
| Taiwanese | 0.3 /100 | #264 | Tragic 97.6% |
| Assyrians/Chaldeans/Syriacs | 0.3 /100 | #265 | Tragic 97.6% |
| Immigrants | Sierra Leone | 0.3 /100 | #266 | Tragic 97.6% |
| Immigrants | Nigeria | 0.3 /100 | #267 | Tragic 97.5% |
| West Indians | 0.3 /100 | #268 | Tragic 97.5% |