American vs Immigrants from Ukraine Bachelor's Degree
COMPARE
American
Immigrants from Ukraine
Bachelor's Degree
Bachelor's Degree Comparison
Americans
Immigrants from Ukraine
31.9%
BACHELOR'S DEGREE
0.2/ 100
METRIC RATING
273rd/ 347
METRIC RANK
41.5%
BACHELOR'S DEGREE
98.3/ 100
METRIC RATING
98th/ 347
METRIC RANK
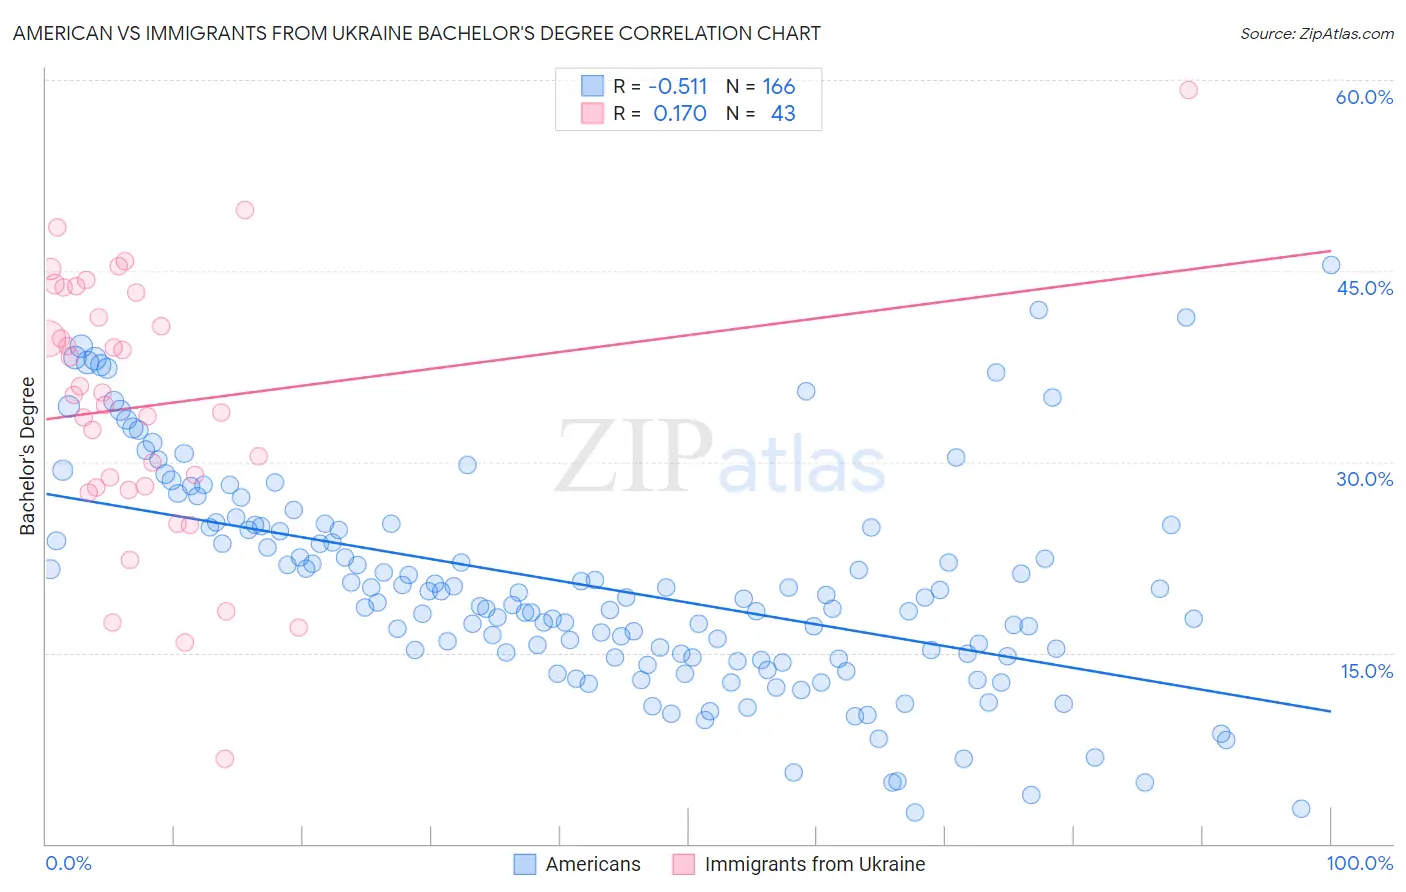
American vs Immigrants from Ukraine Bachelor's Degree Correlation Chart
The statistical analysis conducted on geographies consisting of 581,681,572 people shows a substantial negative correlation between the proportion of Americans and percentage of population with at least bachelor's degree education in the United States with a correlation coefficient (R) of -0.511 and weighted average of 31.9%. Similarly, the statistical analysis conducted on geographies consisting of 289,707,467 people shows a poor positive correlation between the proportion of Immigrants from Ukraine and percentage of population with at least bachelor's degree education in the United States with a correlation coefficient (R) of 0.170 and weighted average of 41.5%, a difference of 30.4%.
Bachelor's Degree Correlation Summary
| Measurement | American | Immigrants from Ukraine |
| Minimum | 2.5% | 6.7% |
| Maximum | 45.5% | 59.3% |
| Range | 43.0% | 52.6% |
| Mean | 20.2% | 34.4% |
| Median | 19.3% | 35.3% |
| Interquartile 25% (IQ1) | 14.6% | 28.0% |
| Interquartile 75% (IQ3) | 24.9% | 43.3% |
| Interquartile Range (IQR) | 10.3% | 15.3% |
| Standard Deviation (Sample) | 8.5% | 10.5% |
| Standard Deviation (Population) | 8.5% | 10.4% |
Similar Demographics by Bachelor's Degree
Demographics Similar to Americans by Bachelor's Degree
In terms of bachelor's degree, the demographic groups most similar to Americans are Potawatomi (31.9%, a difference of 0.020%), Comanche (31.9%, a difference of 0.12%), Central American (31.9%, a difference of 0.15%), Samoan (31.8%, a difference of 0.15%), and Salvadoran (31.8%, a difference of 0.19%).
| Demographics | Rating | Rank | Bachelor's Degree |
| Immigrants | Dominica | 0.3 /100 | #266 | Tragic 32.5% |
| Cubans | 0.3 /100 | #267 | Tragic 32.5% |
| Immigrants | Portugal | 0.2 /100 | #268 | Tragic 32.2% |
| Immigrants | Belize | 0.2 /100 | #269 | Tragic 32.1% |
| Immigrants | Nicaragua | 0.2 /100 | #270 | Tragic 31.9% |
| Central Americans | 0.2 /100 | #271 | Tragic 31.9% |
| Comanche | 0.2 /100 | #272 | Tragic 31.9% |
| Americans | 0.2 /100 | #273 | Tragic 31.9% |
| Potawatomi | 0.2 /100 | #274 | Tragic 31.9% |
| Samoans | 0.1 /100 | #275 | Tragic 31.8% |
| Salvadorans | 0.1 /100 | #276 | Tragic 31.8% |
| Dominicans | 0.1 /100 | #277 | Tragic 31.8% |
| Marshallese | 0.1 /100 | #278 | Tragic 31.7% |
| Hawaiians | 0.1 /100 | #279 | Tragic 31.6% |
| Immigrants | Laos | 0.1 /100 | #280 | Tragic 31.6% |
Demographics Similar to Immigrants from Ukraine by Bachelor's Degree
In terms of bachelor's degree, the demographic groups most similar to Immigrants from Ukraine are Romanian (41.6%, a difference of 0.11%), Immigrants from Moldova (41.6%, a difference of 0.16%), Immigrants from England (41.4%, a difference of 0.24%), Macedonian (41.4%, a difference of 0.26%), and Immigrants from North America (41.7%, a difference of 0.27%).
| Demographics | Rating | Rank | Bachelor's Degree |
| Immigrants | Northern Africa | 98.9 /100 | #91 | Exceptional 41.9% |
| Maltese | 98.8 /100 | #92 | Exceptional 41.9% |
| Immigrants | Canada | 98.6 /100 | #93 | Exceptional 41.7% |
| Immigrants | Nepal | 98.6 /100 | #94 | Exceptional 41.7% |
| Immigrants | North America | 98.5 /100 | #95 | Exceptional 41.7% |
| Immigrants | Moldova | 98.4 /100 | #96 | Exceptional 41.6% |
| Romanians | 98.4 /100 | #97 | Exceptional 41.6% |
| Immigrants | Ukraine | 98.3 /100 | #98 | Exceptional 41.5% |
| Immigrants | England | 98.1 /100 | #99 | Exceptional 41.4% |
| Macedonians | 98.1 /100 | #100 | Exceptional 41.4% |
| Immigrants | Morocco | 98.0 /100 | #101 | Exceptional 41.4% |
| Immigrants | Italy | 97.8 /100 | #102 | Exceptional 41.3% |
| Chileans | 97.5 /100 | #103 | Exceptional 41.2% |
| Jordanians | 97.4 /100 | #104 | Exceptional 41.2% |
| Syrians | 97.4 /100 | #105 | Exceptional 41.1% |