Guyanese vs Immigrants from Norway Nursery School
COMPARE
Guyanese
Immigrants from Norway
Nursery School
Nursery School Comparison
Guyanese
Immigrants from Norway
97.0%
NURSERY SCHOOL
0.0/ 100
METRIC RATING
310th/ 347
METRIC RANK
98.2%
NURSERY SCHOOL
96.6/ 100
METRIC RATING
112th/ 347
METRIC RANK
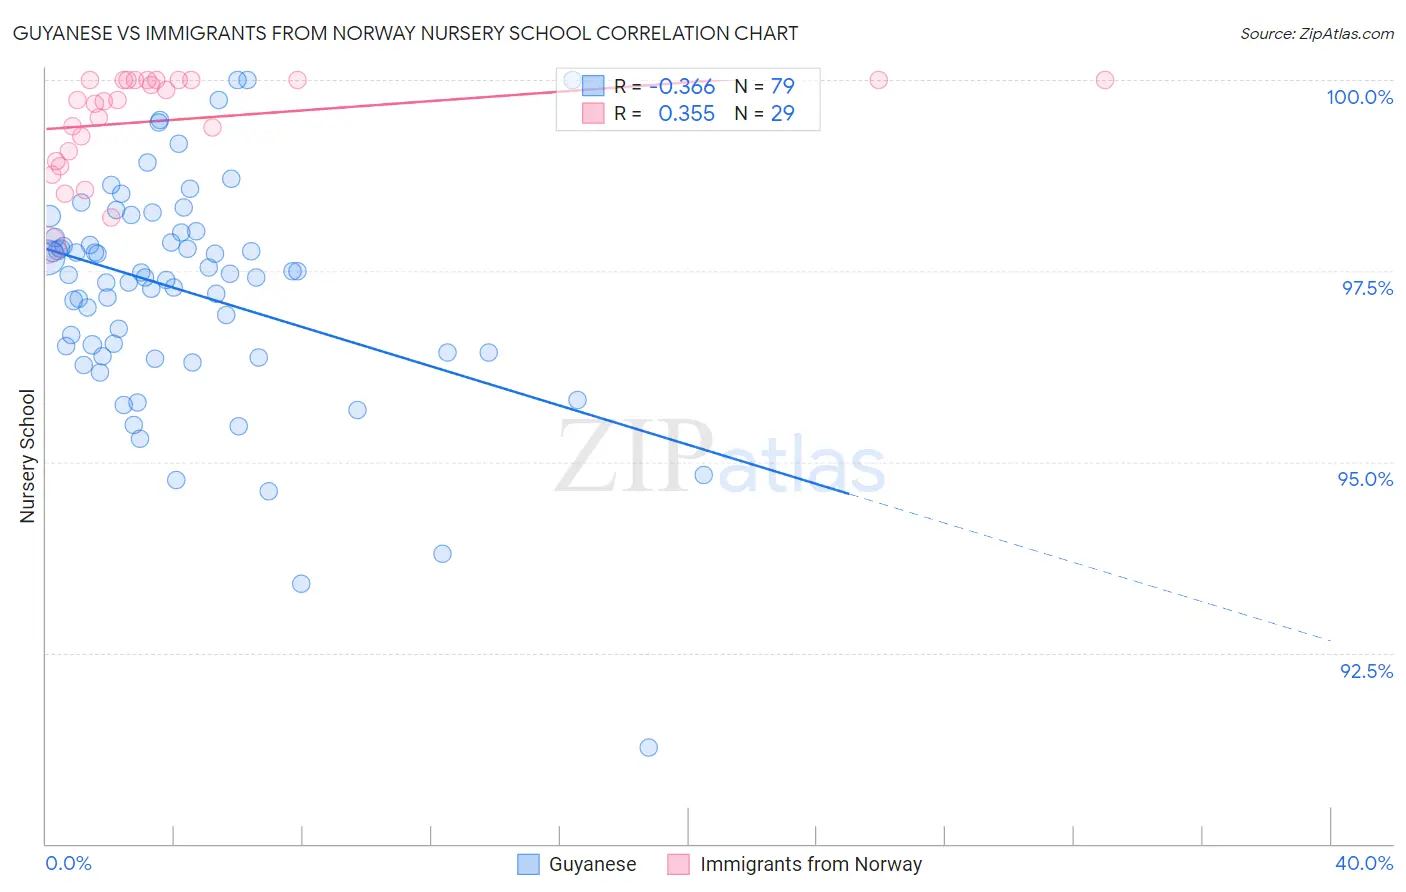
Guyanese vs Immigrants from Norway Nursery School Correlation Chart
The statistical analysis conducted on geographies consisting of 176,921,765 people shows a mild negative correlation between the proportion of Guyanese and percentage of population with at least nursery school education in the United States with a correlation coefficient (R) of -0.366 and weighted average of 97.0%. Similarly, the statistical analysis conducted on geographies consisting of 116,716,420 people shows a mild positive correlation between the proportion of Immigrants from Norway and percentage of population with at least nursery school education in the United States with a correlation coefficient (R) of 0.355 and weighted average of 98.2%, a difference of 1.3%.
Nursery School Correlation Summary
| Measurement | Guyanese | Immigrants from Norway |
| Minimum | 91.3% | 97.8% |
| Maximum | 100.0% | 100.0% |
| Range | 8.7% | 2.2% |
| Mean | 97.2% | 99.5% |
| Median | 97.4% | 99.7% |
| Interquartile 25% (IQ1) | 96.4% | 99.0% |
| Interquartile 75% (IQ3) | 98.0% | 100.0% |
| Interquartile Range (IQR) | 1.6% | 1.00% |
| Standard Deviation (Sample) | 1.5% | 0.63% |
| Standard Deviation (Population) | 1.5% | 0.62% |
Similar Demographics by Nursery School
Demographics Similar to Guyanese by Nursery School
In terms of nursery school, the demographic groups most similar to Guyanese are Immigrants from the Azores (97.0%, a difference of 0.0%), Sri Lankan (97.0%, a difference of 0.0%), Immigrants from Somalia (97.0%, a difference of 0.010%), Belizean (97.0%, a difference of 0.030%), and Hispanic or Latino (97.0%, a difference of 0.030%).
| Demographics | Rating | Rank | Nursery School |
| Nicaraguans | 0.0 /100 | #303 | Tragic 97.1% |
| Ecuadorians | 0.0 /100 | #304 | Tragic 97.1% |
| Somalis | 0.0 /100 | #305 | Tragic 97.1% |
| Belizeans | 0.0 /100 | #306 | Tragic 97.0% |
| Hispanics or Latinos | 0.0 /100 | #307 | Tragic 97.0% |
| Immigrants | Haiti | 0.0 /100 | #308 | Tragic 97.0% |
| Immigrants | Somalia | 0.0 /100 | #309 | Tragic 97.0% |
| Guyanese | 0.0 /100 | #310 | Tragic 97.0% |
| Immigrants | Azores | 0.0 /100 | #311 | Tragic 97.0% |
| Sri Lankans | 0.0 /100 | #312 | Tragic 97.0% |
| Hondurans | 0.0 /100 | #313 | Tragic 97.0% |
| Cape Verdeans | 0.0 /100 | #314 | Tragic 97.0% |
| Immigrants | Nicaragua | 0.0 /100 | #315 | Tragic 96.9% |
| Immigrants | Belize | 0.0 /100 | #316 | Tragic 96.9% |
| Immigrants | Ecuador | 0.0 /100 | #317 | Tragic 96.9% |
Demographics Similar to Immigrants from Norway by Nursery School
In terms of nursery school, the demographic groups most similar to Immigrants from Norway are Immigrants from Latvia (98.2%, a difference of 0.0%), Pima (98.2%, a difference of 0.010%), German Russian (98.2%, a difference of 0.010%), Immigrants from Singapore (98.2%, a difference of 0.010%), and Immigrants from Czechoslovakia (98.2%, a difference of 0.010%).
| Demographics | Rating | Rank | Nursery School |
| Turks | 97.4 /100 | #105 | Exceptional 98.2% |
| Immigrants | Switzerland | 97.3 /100 | #106 | Exceptional 98.2% |
| Basques | 97.3 /100 | #107 | Exceptional 98.2% |
| Pima | 97.1 /100 | #108 | Exceptional 98.2% |
| German Russians | 97.1 /100 | #109 | Exceptional 98.2% |
| Immigrants | Singapore | 96.9 /100 | #110 | Exceptional 98.2% |
| Immigrants | Czechoslovakia | 96.8 /100 | #111 | Exceptional 98.2% |
| Immigrants | Norway | 96.6 /100 | #112 | Exceptional 98.2% |
| Immigrants | Latvia | 96.4 /100 | #113 | Exceptional 98.2% |
| Ute | 96.4 /100 | #114 | Exceptional 98.2% |
| Iranians | 96.3 /100 | #115 | Exceptional 98.2% |
| Spanish | 95.8 /100 | #116 | Exceptional 98.2% |
| Immigrants | France | 95.6 /100 | #117 | Exceptional 98.2% |
| Yugoslavians | 95.4 /100 | #118 | Exceptional 98.2% |
| Thais | 95.0 /100 | #119 | Exceptional 98.2% |