Immigrants from Honduras vs Immigrants from Iraq Doctorate Degree
COMPARE
Immigrants from Honduras
Immigrants from Iraq
Doctorate Degree
Doctorate Degree Comparison
Immigrants from Honduras
Immigrants from Iraq
1.4%
DOCTORATE DEGREE
0.1/ 100
METRIC RATING
311th/ 347
METRIC RANK
1.7%
DOCTORATE DEGREE
10.7/ 100
METRIC RATING
219th/ 347
METRIC RANK
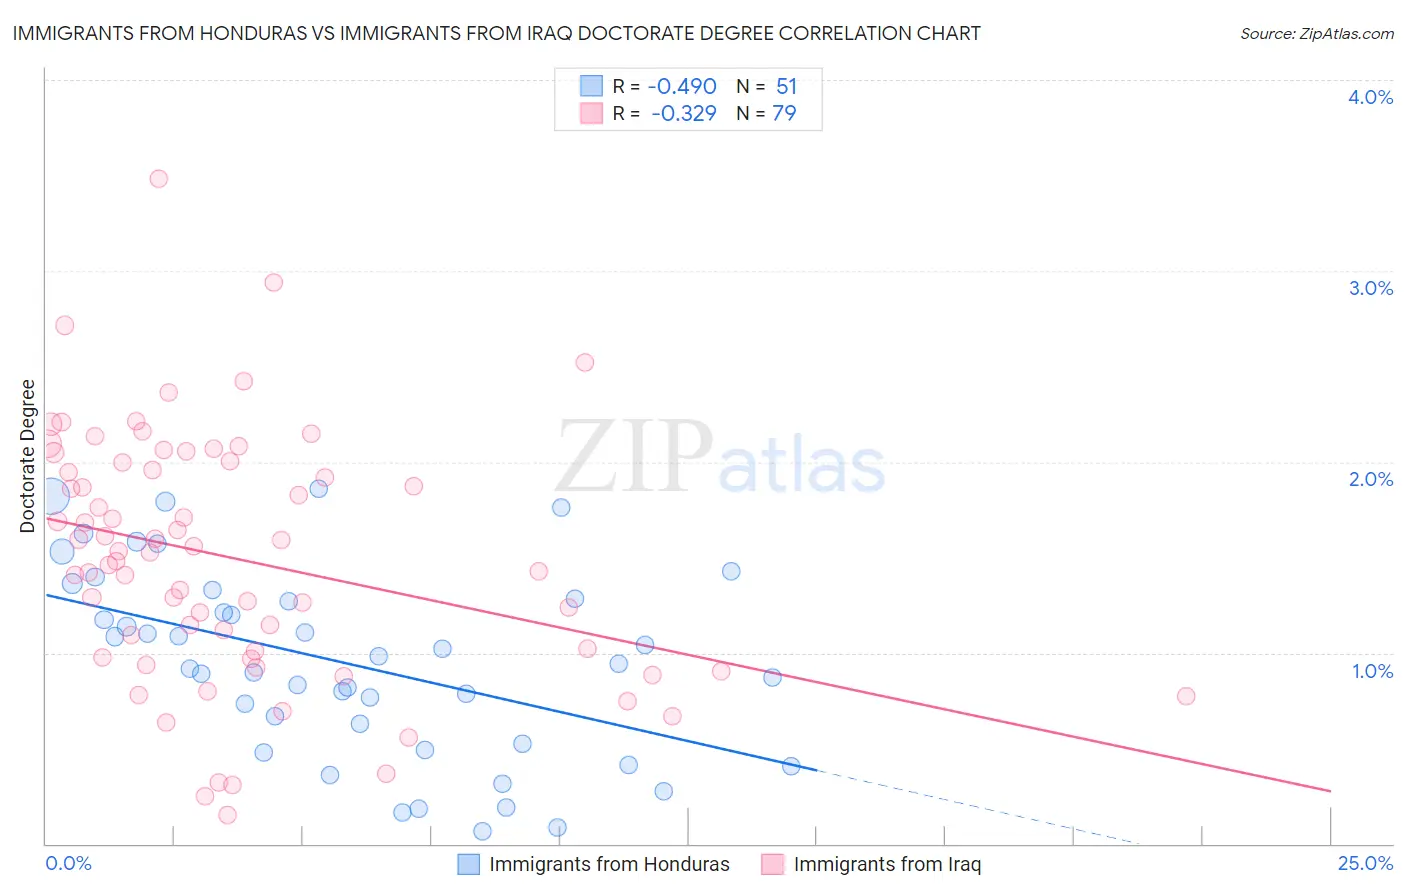
Immigrants from Honduras vs Immigrants from Iraq Doctorate Degree Correlation Chart
The statistical analysis conducted on geographies consisting of 318,827,529 people shows a moderate negative correlation between the proportion of Immigrants from Honduras and percentage of population with at least doctorate degree education in the United States with a correlation coefficient (R) of -0.490 and weighted average of 1.4%. Similarly, the statistical analysis conducted on geographies consisting of 194,187,251 people shows a mild negative correlation between the proportion of Immigrants from Iraq and percentage of population with at least doctorate degree education in the United States with a correlation coefficient (R) of -0.329 and weighted average of 1.7%, a difference of 24.3%.
Doctorate Degree Correlation Summary
| Measurement | Immigrants from Honduras | Immigrants from Iraq |
| Minimum | 0.068% | 0.15% |
| Maximum | 1.9% | 3.5% |
| Range | 1.8% | 3.3% |
| Mean | 0.95% | 1.5% |
| Median | 0.94% | 1.5% |
| Interquartile 25% (IQ1) | 0.52% | 0.97% |
| Interquartile 75% (IQ3) | 1.3% | 2.0% |
| Interquartile Range (IQR) | 0.76% | 1.0% |
| Standard Deviation (Sample) | 0.49% | 0.65% |
| Standard Deviation (Population) | 0.48% | 0.65% |
Similar Demographics by Doctorate Degree
Demographics Similar to Immigrants from Honduras by Doctorate Degree
In terms of doctorate degree, the demographic groups most similar to Immigrants from Honduras are Immigrants from Jamaica (1.4%, a difference of 0.18%), Immigrants from Nicaragua (1.4%, a difference of 0.38%), Immigrants from Grenada (1.4%, a difference of 0.47%), Menominee (1.4%, a difference of 0.69%), and Dominican (1.4%, a difference of 0.77%).
| Demographics | Rating | Rank | Doctorate Degree |
| Mexican American Indians | 0.1 /100 | #304 | Tragic 1.4% |
| Pennsylvania Germans | 0.1 /100 | #305 | Tragic 1.4% |
| Guyanese | 0.1 /100 | #306 | Tragic 1.4% |
| Cubans | 0.1 /100 | #307 | Tragic 1.4% |
| Immigrants | Laos | 0.1 /100 | #308 | Tragic 1.4% |
| Immigrants | Grenada | 0.1 /100 | #309 | Tragic 1.4% |
| Immigrants | Jamaica | 0.1 /100 | #310 | Tragic 1.4% |
| Immigrants | Honduras | 0.1 /100 | #311 | Tragic 1.4% |
| Immigrants | Nicaragua | 0.1 /100 | #312 | Tragic 1.4% |
| Menominee | 0.1 /100 | #313 | Tragic 1.4% |
| Dominicans | 0.1 /100 | #314 | Tragic 1.4% |
| Immigrants | Azores | 0.1 /100 | #315 | Tragic 1.4% |
| Navajo | 0.1 /100 | #316 | Tragic 1.4% |
| Immigrants | Micronesia | 0.1 /100 | #317 | Tragic 1.3% |
| Creek | 0.1 /100 | #318 | Tragic 1.3% |
Demographics Similar to Immigrants from Iraq by Doctorate Degree
In terms of doctorate degree, the demographic groups most similar to Immigrants from Iraq are Tlingit-Haida (1.7%, a difference of 0.46%), Immigrants from Uruguay (1.7%, a difference of 0.66%), Spanish American (1.7%, a difference of 0.84%), Nonimmigrants (1.7%, a difference of 0.85%), and Immigrants from Venezuela (1.7%, a difference of 0.92%).
| Demographics | Rating | Rank | Doctorate Degree |
| Immigrants | South Eastern Asia | 14.7 /100 | #212 | Poor 1.7% |
| Koreans | 14.2 /100 | #213 | Poor 1.7% |
| Pueblo | 14.2 /100 | #214 | Poor 1.7% |
| Alaskan Athabascans | 13.8 /100 | #215 | Poor 1.7% |
| Immigrants | Burma/Myanmar | 13.5 /100 | #216 | Poor 1.7% |
| Spanish Americans | 12.9 /100 | #217 | Poor 1.7% |
| Tlingit-Haida | 11.9 /100 | #218 | Poor 1.7% |
| Immigrants | Iraq | 10.7 /100 | #219 | Poor 1.7% |
| Immigrants | Uruguay | 9.2 /100 | #220 | Tragic 1.7% |
| Immigrants | Nonimmigrants | 8.8 /100 | #221 | Tragic 1.7% |
| Immigrants | Venezuela | 8.7 /100 | #222 | Tragic 1.7% |
| Immigrants | Bosnia and Herzegovina | 7.8 /100 | #223 | Tragic 1.7% |
| Immigrants | Poland | 7.4 /100 | #224 | Tragic 1.7% |
| Immigrants | Colombia | 6.7 /100 | #225 | Tragic 1.7% |
| Osage | 6.5 /100 | #226 | Tragic 1.7% |