Alsatian vs Black/African American College, 1 year or more
COMPARE
Alsatian
Black/African American
College, 1 year or more
College, 1 year or more Comparison
Alsatians
Blacks/African Americans
61.3%
COLLEGE, 1 YEAR OR MORE
91.3/ 100
METRIC RATING
126th/ 347
METRIC RANK
53.3%
COLLEGE, 1 YEAR OR MORE
0.0/ 100
METRIC RATING
293rd/ 347
METRIC RANK
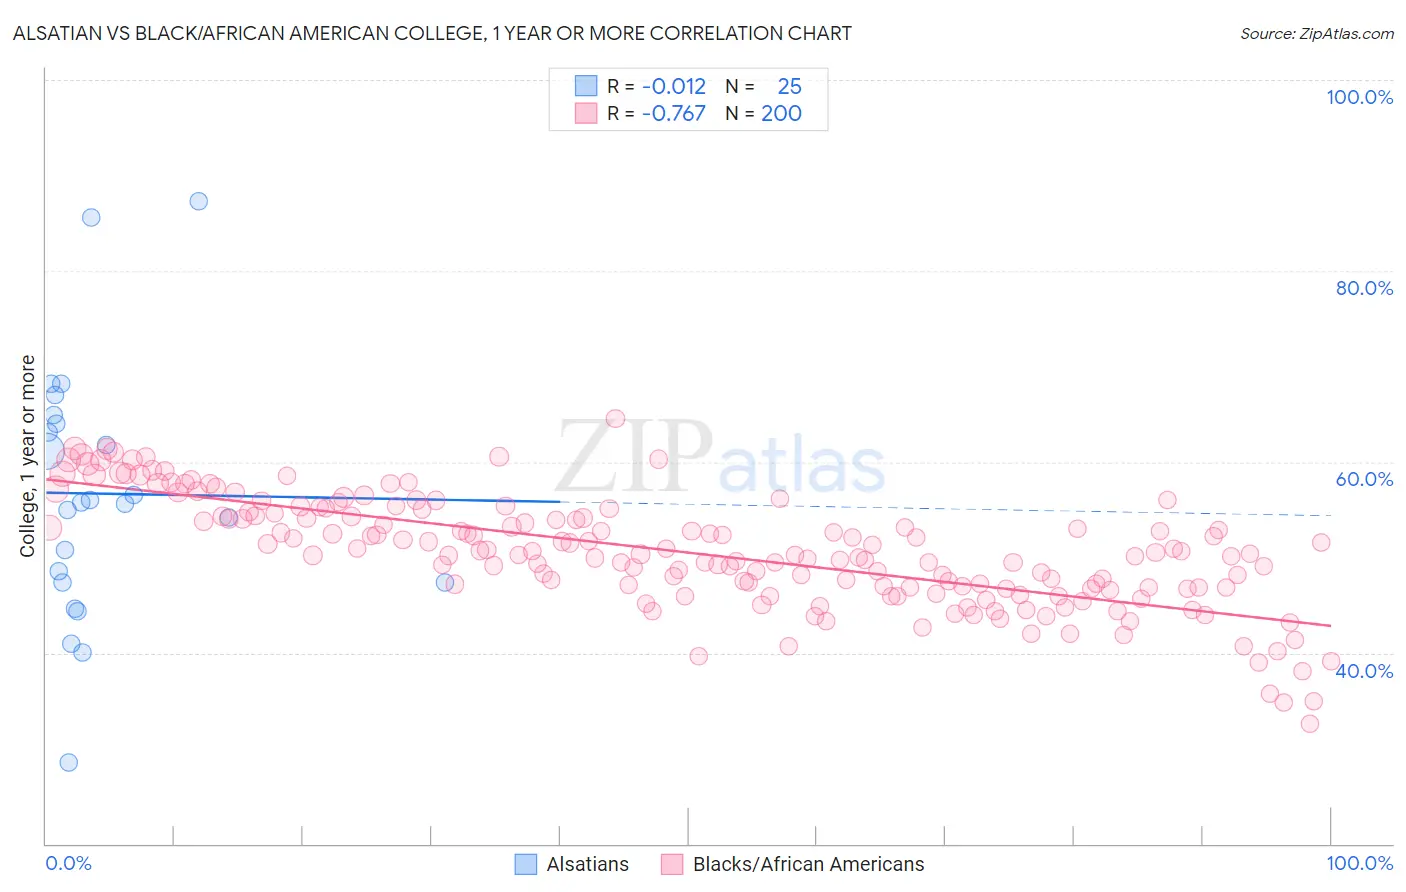
Alsatian vs Black/African American College, 1 year or more Correlation Chart
The statistical analysis conducted on geographies consisting of 82,682,365 people shows no correlation between the proportion of Alsatians and percentage of population with at least college, 1 year or more education in the United States with a correlation coefficient (R) of -0.012 and weighted average of 61.3%. Similarly, the statistical analysis conducted on geographies consisting of 566,034,160 people shows a strong negative correlation between the proportion of Blacks/African Americans and percentage of population with at least college, 1 year or more education in the United States with a correlation coefficient (R) of -0.767 and weighted average of 53.3%, a difference of 14.9%.
College, 1 year or more Correlation Summary
| Measurement | Alsatian | Black/African American |
| Minimum | 28.5% | 32.6% |
| Maximum | 87.3% | 64.6% |
| Range | 58.8% | 32.0% |
| Mean | 56.7% | 50.5% |
| Median | 55.8% | 50.3% |
| Interquartile 25% (IQ1) | 47.4% | 46.8% |
| Interquartile 75% (IQ3) | 64.4% | 54.3% |
| Interquartile Range (IQR) | 17.1% | 7.5% |
| Standard Deviation (Sample) | 13.3% | 5.8% |
| Standard Deviation (Population) | 13.0% | 5.8% |
Similar Demographics by College, 1 year or more
Demographics Similar to Alsatians by College, 1 year or more
In terms of college, 1 year or more, the demographic groups most similar to Alsatians are Immigrants from Eastern Africa (61.2%, a difference of 0.030%), Immigrants from Italy (61.2%, a difference of 0.030%), Immigrants from Syria (61.3%, a difference of 0.050%), Ugandan (61.2%, a difference of 0.090%), and Venezuelan (61.3%, a difference of 0.13%).
| Demographics | Rating | Rank | College, 1 year or more |
| Assyrians/Chaldeans/Syriacs | 93.3 /100 | #119 | Exceptional 61.5% |
| Pakistanis | 93.2 /100 | #120 | Exceptional 61.5% |
| Immigrants | Jordan | 92.7 /100 | #121 | Exceptional 61.4% |
| Immigrants | Chile | 92.3 /100 | #122 | Exceptional 61.4% |
| Serbians | 92.2 /100 | #123 | Exceptional 61.4% |
| Venezuelans | 92.1 /100 | #124 | Exceptional 61.3% |
| Immigrants | Syria | 91.6 /100 | #125 | Exceptional 61.3% |
| Alsatians | 91.3 /100 | #126 | Exceptional 61.3% |
| Immigrants | Eastern Africa | 91.1 /100 | #127 | Exceptional 61.2% |
| Immigrants | Italy | 91.1 /100 | #128 | Exceptional 61.2% |
| Ugandans | 90.7 /100 | #129 | Exceptional 61.2% |
| Italians | 89.5 /100 | #130 | Excellent 61.1% |
| Immigrants | Morocco | 89.5 /100 | #131 | Excellent 61.1% |
| Scandinavians | 88.2 /100 | #132 | Excellent 61.0% |
| Immigrants | Uzbekistan | 88.0 /100 | #133 | Excellent 61.0% |
Demographics Similar to Blacks/African Americans by College, 1 year or more
In terms of college, 1 year or more, the demographic groups most similar to Blacks/African Americans are Chickasaw (53.3%, a difference of 0.020%), Cuban (53.4%, a difference of 0.15%), Alaskan Athabascan (53.4%, a difference of 0.20%), Cherokee (53.2%, a difference of 0.21%), and Alaska Native (53.4%, a difference of 0.22%).
| Demographics | Rating | Rank | College, 1 year or more |
| Central American Indians | 0.1 /100 | #286 | Tragic 53.5% |
| Immigrants | Belize | 0.1 /100 | #287 | Tragic 53.5% |
| Alaska Natives | 0.0 /100 | #288 | Tragic 53.4% |
| Immigrants | Ecuador | 0.0 /100 | #289 | Tragic 53.4% |
| Alaskan Athabascans | 0.0 /100 | #290 | Tragic 53.4% |
| Cubans | 0.0 /100 | #291 | Tragic 53.4% |
| Chickasaw | 0.0 /100 | #292 | Tragic 53.3% |
| Blacks/African Americans | 0.0 /100 | #293 | Tragic 53.3% |
| Cherokee | 0.0 /100 | #294 | Tragic 53.2% |
| Yaqui | 0.0 /100 | #295 | Tragic 53.2% |
| Sioux | 0.0 /100 | #296 | Tragic 53.0% |
| Paiute | 0.0 /100 | #297 | Tragic 52.9% |
| Immigrants | Dominica | 0.0 /100 | #298 | Tragic 52.5% |
| Immigrants | Nicaragua | 0.0 /100 | #299 | Tragic 52.4% |
| Choctaw | 0.0 /100 | #300 | Tragic 52.3% |