Alsatian vs Turkish College, 1 year or more
COMPARE
Alsatian
Turkish
College, 1 year or more
College, 1 year or more Comparison
Alsatians
Turks
61.3%
COLLEGE, 1 YEAR OR MORE
91.3/ 100
METRIC RATING
126th/ 347
METRIC RANK
65.5%
COLLEGE, 1 YEAR OR MORE
100.0/ 100
METRIC RATING
31st/ 347
METRIC RANK
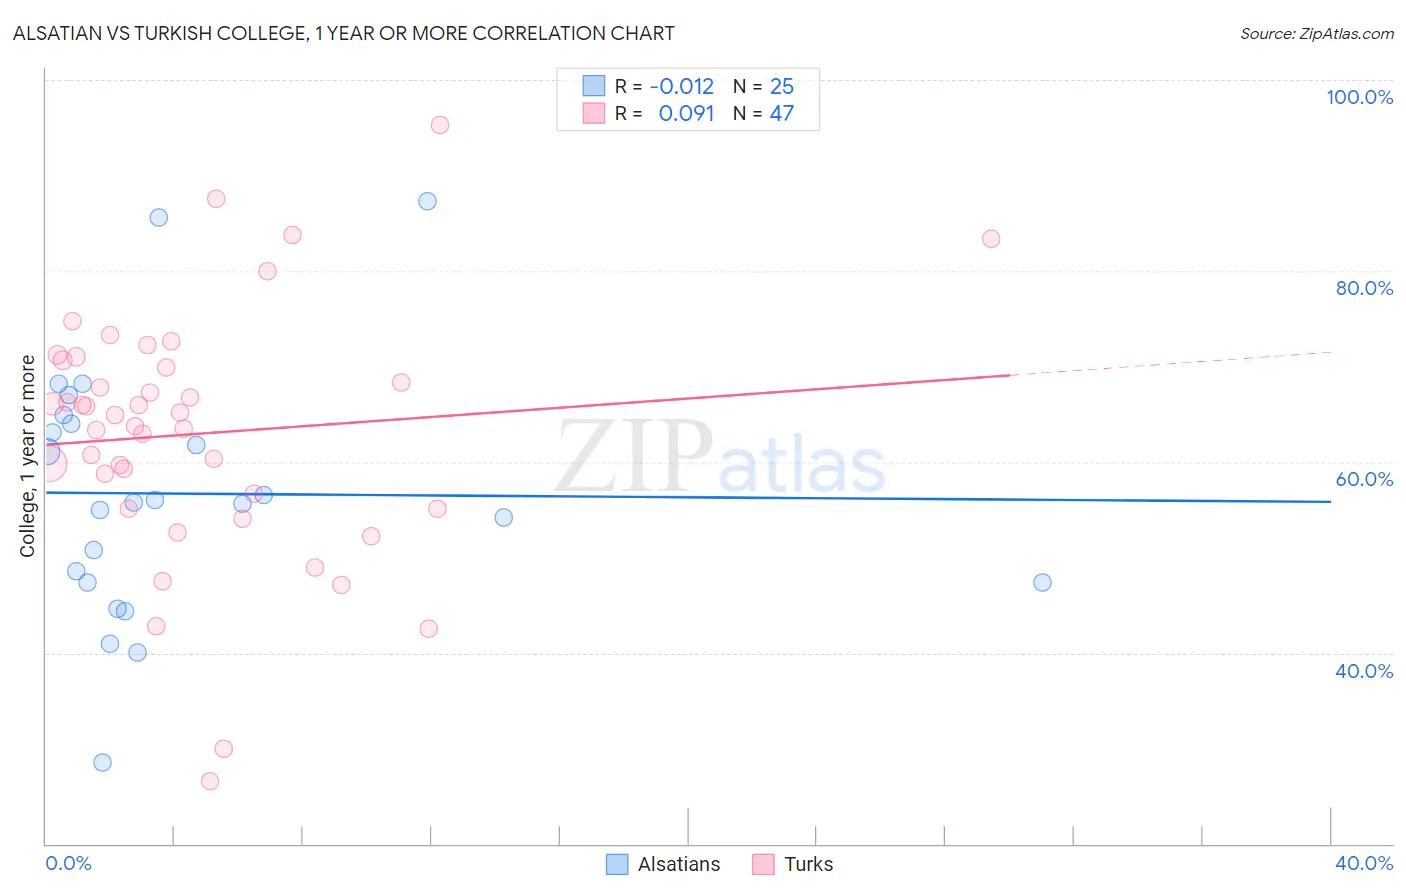
Alsatian vs Turkish College, 1 year or more Correlation Chart
The statistical analysis conducted on geographies consisting of 82,682,365 people shows no correlation between the proportion of Alsatians and percentage of population with at least college, 1 year or more education in the United States with a correlation coefficient (R) of -0.012 and weighted average of 61.3%. Similarly, the statistical analysis conducted on geographies consisting of 271,864,133 people shows a slight positive correlation between the proportion of Turks and percentage of population with at least college, 1 year or more education in the United States with a correlation coefficient (R) of 0.091 and weighted average of 65.5%, a difference of 7.0%.
College, 1 year or more Correlation Summary
| Measurement | Alsatian | Turkish |
| Minimum | 28.5% | 26.5% |
| Maximum | 87.3% | 95.2% |
| Range | 58.8% | 68.7% |
| Mean | 56.7% | 63.0% |
| Median | 55.8% | 64.9% |
| Interquartile 25% (IQ1) | 47.4% | 55.1% |
| Interquartile 75% (IQ3) | 64.4% | 70.6% |
| Interquartile Range (IQR) | 17.1% | 15.5% |
| Standard Deviation (Sample) | 13.3% | 13.2% |
| Standard Deviation (Population) | 13.0% | 13.1% |
Similar Demographics by College, 1 year or more
Demographics Similar to Alsatians by College, 1 year or more
In terms of college, 1 year or more, the demographic groups most similar to Alsatians are Immigrants from Eastern Africa (61.2%, a difference of 0.030%), Immigrants from Italy (61.2%, a difference of 0.030%), Immigrants from Syria (61.3%, a difference of 0.050%), Ugandan (61.2%, a difference of 0.090%), and Venezuelan (61.3%, a difference of 0.13%).
| Demographics | Rating | Rank | College, 1 year or more |
| Assyrians/Chaldeans/Syriacs | 93.3 /100 | #119 | Exceptional 61.5% |
| Pakistanis | 93.2 /100 | #120 | Exceptional 61.5% |
| Immigrants | Jordan | 92.7 /100 | #121 | Exceptional 61.4% |
| Immigrants | Chile | 92.3 /100 | #122 | Exceptional 61.4% |
| Serbians | 92.2 /100 | #123 | Exceptional 61.4% |
| Venezuelans | 92.1 /100 | #124 | Exceptional 61.3% |
| Immigrants | Syria | 91.6 /100 | #125 | Exceptional 61.3% |
| Alsatians | 91.3 /100 | #126 | Exceptional 61.3% |
| Immigrants | Eastern Africa | 91.1 /100 | #127 | Exceptional 61.2% |
| Immigrants | Italy | 91.1 /100 | #128 | Exceptional 61.2% |
| Ugandans | 90.7 /100 | #129 | Exceptional 61.2% |
| Italians | 89.5 /100 | #130 | Excellent 61.1% |
| Immigrants | Morocco | 89.5 /100 | #131 | Excellent 61.1% |
| Scandinavians | 88.2 /100 | #132 | Excellent 61.0% |
| Immigrants | Uzbekistan | 88.0 /100 | #133 | Excellent 61.0% |
Demographics Similar to Turks by College, 1 year or more
In terms of college, 1 year or more, the demographic groups most similar to Turks are Bulgarian (65.5%, a difference of 0.050%), Immigrants from Denmark (65.6%, a difference of 0.080%), Immigrants from Northern Europe (65.6%, a difference of 0.19%), Immigrants from Sri Lanka (65.4%, a difference of 0.20%), and Israeli (65.3%, a difference of 0.32%).
| Demographics | Rating | Rank | College, 1 year or more |
| Immigrants | Belgium | 100.0 /100 | #24 | Exceptional 66.3% |
| Indians (Asian) | 100.0 /100 | #25 | Exceptional 66.1% |
| Latvians | 100.0 /100 | #26 | Exceptional 66.1% |
| Immigrants | Ireland | 100.0 /100 | #27 | Exceptional 65.9% |
| Immigrants | France | 100.0 /100 | #28 | Exceptional 65.8% |
| Immigrants | Northern Europe | 100.0 /100 | #29 | Exceptional 65.6% |
| Immigrants | Denmark | 100.0 /100 | #30 | Exceptional 65.6% |
| Turks | 100.0 /100 | #31 | Exceptional 65.5% |
| Bulgarians | 100.0 /100 | #32 | Exceptional 65.5% |
| Immigrants | Sri Lanka | 99.9 /100 | #33 | Exceptional 65.4% |
| Israelis | 99.9 /100 | #34 | Exceptional 65.3% |
| Immigrants | Turkey | 99.9 /100 | #35 | Exceptional 65.2% |
| Immigrants | South Africa | 99.9 /100 | #36 | Exceptional 65.1% |
| Russians | 99.9 /100 | #37 | Exceptional 65.1% |
| Immigrants | Saudi Arabia | 99.9 /100 | #38 | Exceptional 65.0% |