Alsatian vs Black/African American In Labor Force | Age 45-54
COMPARE
Alsatian
Black/African American
In Labor Force | Age 45-54
In Labor Force | Age 45-54 Comparison
Alsatians
Blacks/African Americans
81.3%
IN LABOR FORCE | AGE 45-54
0.0/ 100
METRIC RATING
269th/ 347
METRIC RANK
79.3%
IN LABOR FORCE | AGE 45-54
0.0/ 100
METRIC RATING
315th/ 347
METRIC RANK
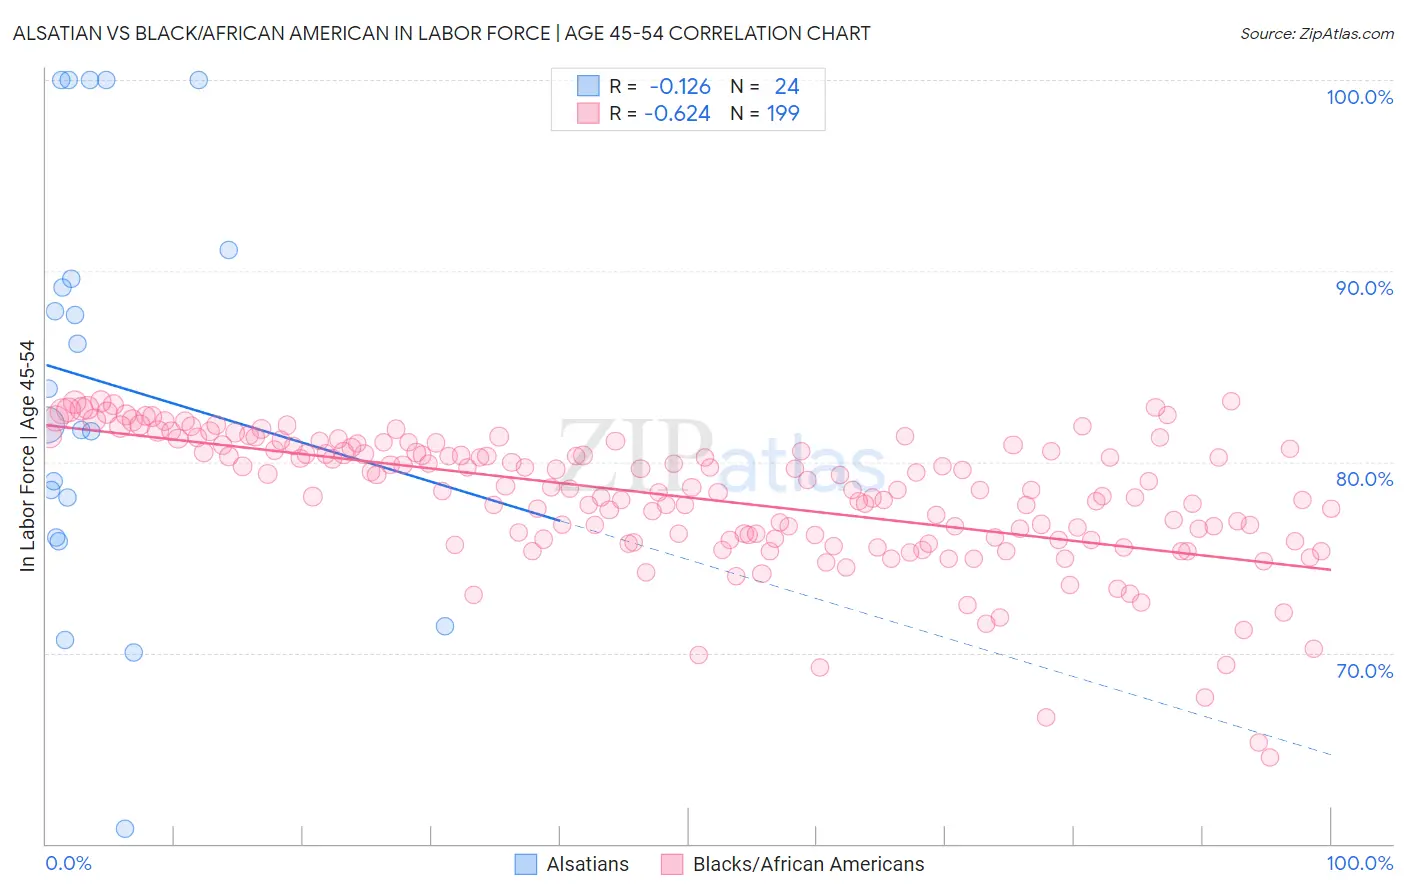
Alsatian vs Black/African American In Labor Force | Age 45-54 Correlation Chart
The statistical analysis conducted on geographies consisting of 82,679,176 people shows a poor negative correlation between the proportion of Alsatians and labor force participation rate among population between the ages 45 and 54 in the United States with a correlation coefficient (R) of -0.126 and weighted average of 81.3%. Similarly, the statistical analysis conducted on geographies consisting of 565,123,910 people shows a significant negative correlation between the proportion of Blacks/African Americans and labor force participation rate among population between the ages 45 and 54 in the United States with a correlation coefficient (R) of -0.624 and weighted average of 79.3%, a difference of 2.5%.
In Labor Force | Age 45-54 Correlation Summary
| Measurement | Alsatian | Black/African American |
| Minimum | 60.8% | 64.5% |
| Maximum | 100.0% | 83.2% |
| Range | 39.2% | 18.7% |
| Mean | 84.2% | 78.1% |
| Median | 82.9% | 78.6% |
| Interquartile 25% (IQ1) | 77.1% | 75.9% |
| Interquartile 75% (IQ3) | 90.3% | 80.8% |
| Interquartile Range (IQR) | 13.2% | 4.9% |
| Standard Deviation (Sample) | 10.9% | 3.5% |
| Standard Deviation (Population) | 10.7% | 3.5% |
Similar Demographics by In Labor Force | Age 45-54
Demographics Similar to Alsatians by In Labor Force | Age 45-54
In terms of in labor force | age 45-54, the demographic groups most similar to Alsatians are Immigrants from Honduras (81.4%, a difference of 0.020%), Bangladeshi (81.3%, a difference of 0.030%), West Indian (81.4%, a difference of 0.040%), Immigrants from Barbados (81.3%, a difference of 0.040%), and Spanish (81.3%, a difference of 0.040%).
| Demographics | Rating | Rank | In Labor Force | Age 45-54 |
| Immigrants | Guyana | 0.1 /100 | #262 | Tragic 81.5% |
| Indonesians | 0.1 /100 | #263 | Tragic 81.5% |
| Immigrants | West Indies | 0.1 /100 | #264 | Tragic 81.5% |
| Hondurans | 0.1 /100 | #265 | Tragic 81.4% |
| Immigrants | St. Vincent and the Grenadines | 0.1 /100 | #266 | Tragic 81.4% |
| West Indians | 0.1 /100 | #267 | Tragic 81.4% |
| Immigrants | Honduras | 0.0 /100 | #268 | Tragic 81.4% |
| Alsatians | 0.0 /100 | #269 | Tragic 81.3% |
| Bangladeshis | 0.0 /100 | #270 | Tragic 81.3% |
| Immigrants | Barbados | 0.0 /100 | #271 | Tragic 81.3% |
| Spanish | 0.0 /100 | #272 | Tragic 81.3% |
| Chippewa | 0.0 /100 | #273 | Tragic 81.3% |
| British West Indians | 0.0 /100 | #274 | Tragic 81.2% |
| Immigrants | Nonimmigrants | 0.0 /100 | #275 | Tragic 81.2% |
| U.S. Virgin Islanders | 0.0 /100 | #276 | Tragic 81.2% |
Demographics Similar to Blacks/African Americans by In Labor Force | Age 45-54
In terms of in labor force | age 45-54, the demographic groups most similar to Blacks/African Americans are Shoshone (79.3%, a difference of 0.080%), Ottawa (79.5%, a difference of 0.14%), Colville (79.5%, a difference of 0.17%), Comanche (79.2%, a difference of 0.22%), and Chickasaw (79.0%, a difference of 0.39%).
| Demographics | Rating | Rank | In Labor Force | Age 45-54 |
| Central American Indians | 0.0 /100 | #308 | Tragic 80.0% |
| Potawatomi | 0.0 /100 | #309 | Tragic 80.0% |
| Inupiat | 0.0 /100 | #310 | Tragic 79.9% |
| Mexicans | 0.0 /100 | #311 | Tragic 79.8% |
| Immigrants | Mexico | 0.0 /100 | #312 | Tragic 79.7% |
| Colville | 0.0 /100 | #313 | Tragic 79.5% |
| Ottawa | 0.0 /100 | #314 | Tragic 79.5% |
| Blacks/African Americans | 0.0 /100 | #315 | Tragic 79.3% |
| Shoshone | 0.0 /100 | #316 | Tragic 79.3% |
| Comanche | 0.0 /100 | #317 | Tragic 79.2% |
| Chickasaw | 0.0 /100 | #318 | Tragic 79.0% |
| Cherokee | 0.0 /100 | #319 | Tragic 79.0% |
| Yaqui | 0.0 /100 | #320 | Tragic 78.9% |
| Yup'ik | 0.0 /100 | #321 | Tragic 78.6% |
| Crow | 0.0 /100 | #322 | Tragic 78.3% |