Alsatian vs Malaysian College, 1 year or more
COMPARE
Alsatian
Malaysian
College, 1 year or more
College, 1 year or more Comparison
Alsatians
Malaysians
61.3%
COLLEGE, 1 YEAR OR MORE
91.3/ 100
METRIC RATING
126th/ 347
METRIC RANK
55.6%
COLLEGE, 1 YEAR OR MORE
0.8/ 100
METRIC RATING
246th/ 347
METRIC RANK
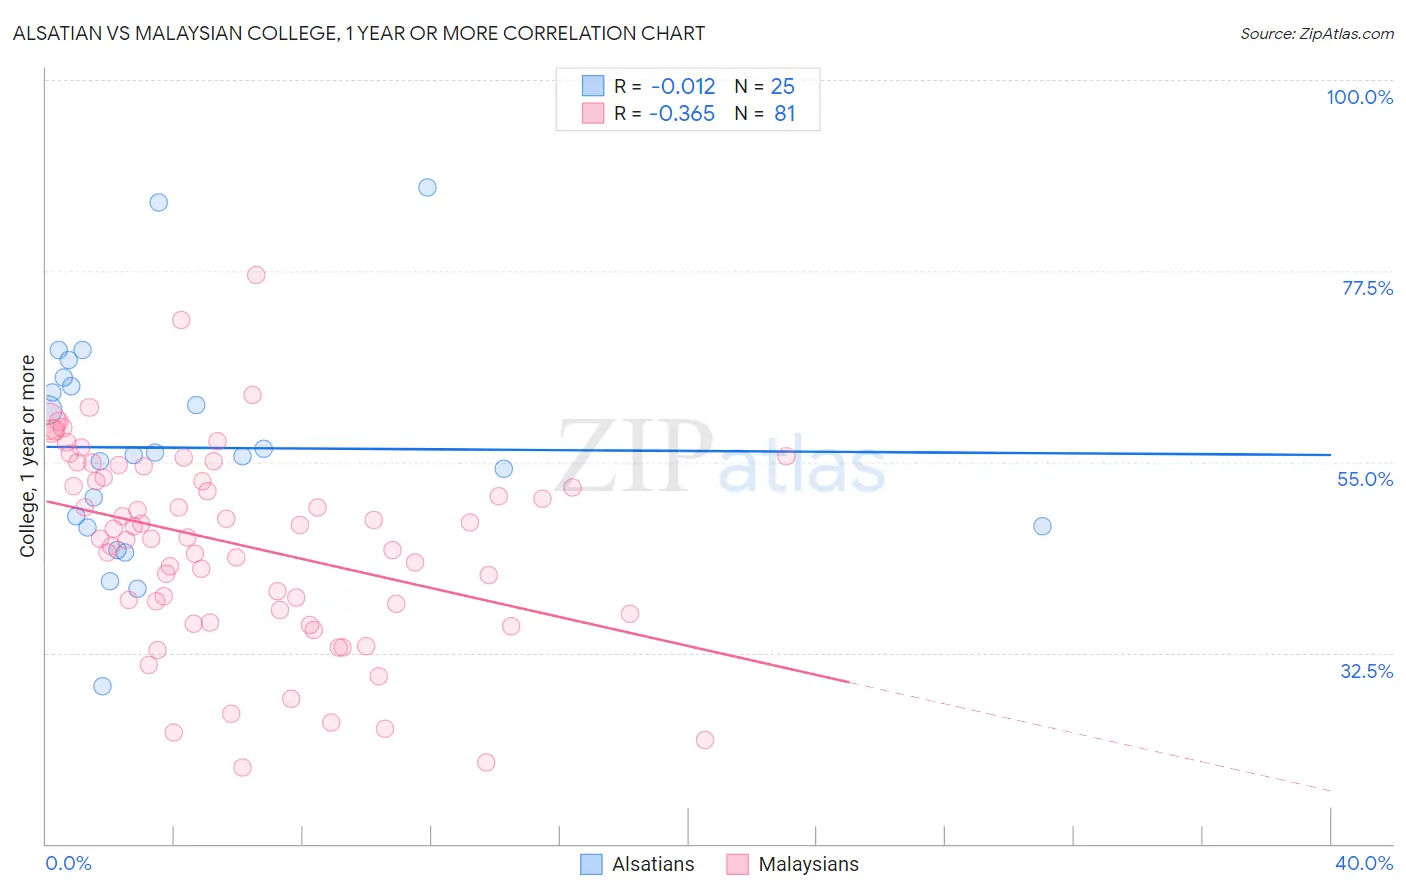
Alsatian vs Malaysian College, 1 year or more Correlation Chart
The statistical analysis conducted on geographies consisting of 82,682,365 people shows no correlation between the proportion of Alsatians and percentage of population with at least college, 1 year or more education in the United States with a correlation coefficient (R) of -0.012 and weighted average of 61.3%. Similarly, the statistical analysis conducted on geographies consisting of 226,108,921 people shows a mild negative correlation between the proportion of Malaysians and percentage of population with at least college, 1 year or more education in the United States with a correlation coefficient (R) of -0.365 and weighted average of 55.6%, a difference of 10.1%.
College, 1 year or more Correlation Summary
| Measurement | Alsatian | Malaysian |
| Minimum | 28.5% | 19.0% |
| Maximum | 87.3% | 77.1% |
| Range | 58.8% | 58.1% |
| Mean | 56.7% | 45.2% |
| Median | 55.8% | 46.1% |
| Interquartile 25% (IQ1) | 47.4% | 37.3% |
| Interquartile 75% (IQ3) | 64.4% | 53.8% |
| Interquartile Range (IQR) | 17.1% | 16.5% |
| Standard Deviation (Sample) | 13.3% | 11.7% |
| Standard Deviation (Population) | 13.0% | 11.6% |
Similar Demographics by College, 1 year or more
Demographics Similar to Alsatians by College, 1 year or more
In terms of college, 1 year or more, the demographic groups most similar to Alsatians are Immigrants from Eastern Africa (61.2%, a difference of 0.030%), Immigrants from Italy (61.2%, a difference of 0.030%), Immigrants from Syria (61.3%, a difference of 0.050%), Ugandan (61.2%, a difference of 0.090%), and Venezuelan (61.3%, a difference of 0.13%).
| Demographics | Rating | Rank | College, 1 year or more |
| Assyrians/Chaldeans/Syriacs | 93.3 /100 | #119 | Exceptional 61.5% |
| Pakistanis | 93.2 /100 | #120 | Exceptional 61.5% |
| Immigrants | Jordan | 92.7 /100 | #121 | Exceptional 61.4% |
| Immigrants | Chile | 92.3 /100 | #122 | Exceptional 61.4% |
| Serbians | 92.2 /100 | #123 | Exceptional 61.4% |
| Venezuelans | 92.1 /100 | #124 | Exceptional 61.3% |
| Immigrants | Syria | 91.6 /100 | #125 | Exceptional 61.3% |
| Alsatians | 91.3 /100 | #126 | Exceptional 61.3% |
| Immigrants | Eastern Africa | 91.1 /100 | #127 | Exceptional 61.2% |
| Immigrants | Italy | 91.1 /100 | #128 | Exceptional 61.2% |
| Ugandans | 90.7 /100 | #129 | Exceptional 61.2% |
| Italians | 89.5 /100 | #130 | Excellent 61.1% |
| Immigrants | Morocco | 89.5 /100 | #131 | Excellent 61.1% |
| Scandinavians | 88.2 /100 | #132 | Excellent 61.0% |
| Immigrants | Uzbekistan | 88.0 /100 | #133 | Excellent 61.0% |
Demographics Similar to Malaysians by College, 1 year or more
In terms of college, 1 year or more, the demographic groups most similar to Malaysians are Immigrants from Liberia (55.7%, a difference of 0.050%), Hawaiian (55.6%, a difference of 0.070%), Chippewa (55.7%, a difference of 0.11%), Immigrants from Congo (55.6%, a difference of 0.11%), and Immigrants from Trinidad and Tobago (55.5%, a difference of 0.21%).
| Demographics | Rating | Rank | College, 1 year or more |
| Puget Sound Salish | 1.1 /100 | #239 | Tragic 55.9% |
| Trinidadians and Tobagonians | 1.1 /100 | #240 | Tragic 55.8% |
| French American Indians | 1.0 /100 | #241 | Tragic 55.8% |
| Marshallese | 1.0 /100 | #242 | Tragic 55.8% |
| Osage | 1.0 /100 | #243 | Tragic 55.8% |
| Chippewa | 0.9 /100 | #244 | Tragic 55.7% |
| Immigrants | Liberia | 0.8 /100 | #245 | Tragic 55.7% |
| Malaysians | 0.8 /100 | #246 | Tragic 55.6% |
| Hawaiians | 0.8 /100 | #247 | Tragic 55.6% |
| Immigrants | Congo | 0.8 /100 | #248 | Tragic 55.6% |
| Immigrants | Trinidad and Tobago | 0.7 /100 | #249 | Tragic 55.5% |
| Delaware | 0.7 /100 | #250 | Tragic 55.5% |
| Immigrants | Cambodia | 0.6 /100 | #251 | Tragic 55.4% |
| Aleuts | 0.6 /100 | #252 | Tragic 55.4% |
| Immigrants | Barbados | 0.6 /100 | #253 | Tragic 55.4% |