Aleut vs Immigrants from Chile 3rd Grade
COMPARE
Aleut
Immigrants from Chile
3rd Grade
3rd Grade Comparison
Aleuts
Immigrants from Chile
98.5%
3RD GRADE
100.0/ 100
METRIC RATING
26th/ 347
METRIC RANK
97.6%
3RD GRADE
16.5/ 100
METRIC RATING
204th/ 347
METRIC RANK
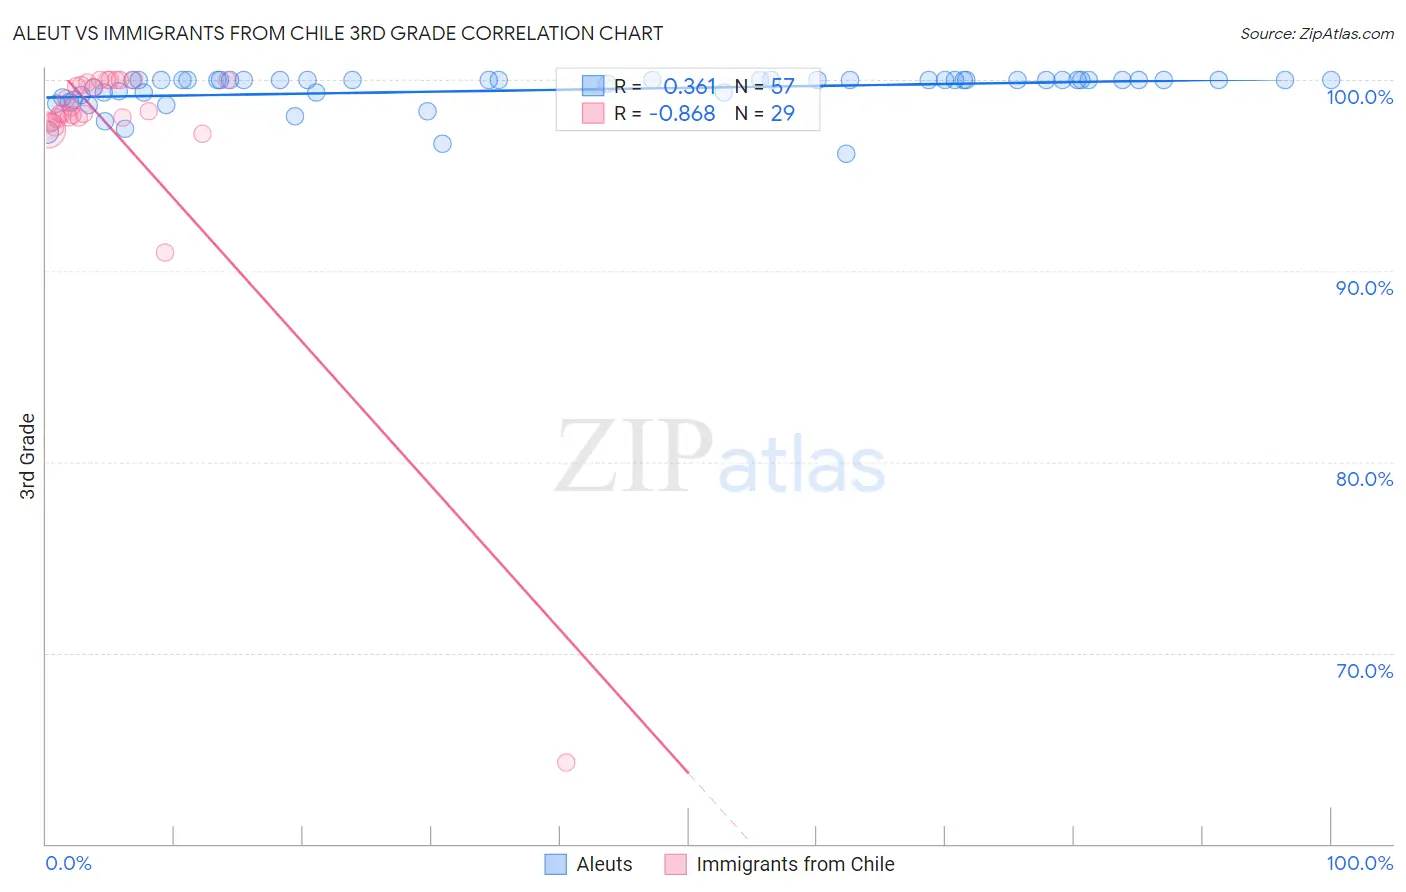
Aleut vs Immigrants from Chile 3rd Grade Correlation Chart
The statistical analysis conducted on geographies consisting of 61,781,033 people shows a mild positive correlation between the proportion of Aleuts and percentage of population with at least 3rd grade education in the United States with a correlation coefficient (R) of 0.361 and weighted average of 98.5%. Similarly, the statistical analysis conducted on geographies consisting of 218,647,266 people shows a very strong negative correlation between the proportion of Immigrants from Chile and percentage of population with at least 3rd grade education in the United States with a correlation coefficient (R) of -0.868 and weighted average of 97.6%, a difference of 0.86%.
3rd Grade Correlation Summary
| Measurement | Aleut | Immigrants from Chile |
| Minimum | 96.2% | 64.3% |
| Maximum | 100.0% | 100.0% |
| Range | 3.8% | 35.7% |
| Mean | 99.5% | 97.3% |
| Median | 100.0% | 98.2% |
| Interquartile 25% (IQ1) | 99.3% | 97.9% |
| Interquartile 75% (IQ3) | 100.0% | 99.9% |
| Interquartile Range (IQR) | 0.74% | 2.0% |
| Standard Deviation (Sample) | 0.91% | 6.6% |
| Standard Deviation (Population) | 0.91% | 6.5% |
Similar Demographics by 3rd Grade
Demographics Similar to Aleuts by 3rd Grade
In terms of 3rd grade, the demographic groups most similar to Aleuts are Sioux (98.5%, a difference of 0.010%), Danish (98.5%, a difference of 0.010%), Scotch-Irish (98.5%, a difference of 0.010%), Croatian (98.5%, a difference of 0.010%), and Polish (98.5%, a difference of 0.020%).
| Demographics | Rating | Rank | 3rd Grade |
| Poles | 100.0 /100 | #19 | Exceptional 98.5% |
| Pennsylvania Germans | 100.0 /100 | #20 | Exceptional 98.5% |
| Lithuanians | 100.0 /100 | #21 | Exceptional 98.5% |
| Finns | 100.0 /100 | #22 | Exceptional 98.5% |
| Sioux | 100.0 /100 | #23 | Exceptional 98.5% |
| Danes | 100.0 /100 | #24 | Exceptional 98.5% |
| Scotch-Irish | 100.0 /100 | #25 | Exceptional 98.5% |
| Aleuts | 100.0 /100 | #26 | Exceptional 98.5% |
| Croatians | 100.0 /100 | #27 | Exceptional 98.5% |
| French | 100.0 /100 | #28 | Exceptional 98.4% |
| French Canadians | 100.0 /100 | #29 | Exceptional 98.4% |
| Europeans | 100.0 /100 | #30 | Exceptional 98.4% |
| Czechs | 100.0 /100 | #31 | Exceptional 98.4% |
| Scandinavians | 100.0 /100 | #32 | Exceptional 98.4% |
| Chinese | 100.0 /100 | #33 | Exceptional 98.4% |
Demographics Similar to Immigrants from Chile by 3rd Grade
In terms of 3rd grade, the demographic groups most similar to Immigrants from Chile are Paiute (97.6%, a difference of 0.0%), Immigrants from Southern Europe (97.6%, a difference of 0.010%), African (97.6%, a difference of 0.010%), Immigrants from Northern Africa (97.6%, a difference of 0.020%), and Immigrants from Ukraine (97.7%, a difference of 0.030%).
| Demographics | Rating | Rank | 3rd Grade |
| Hawaiians | 25.7 /100 | #197 | Fair 97.7% |
| Guamanians/Chamorros | 23.6 /100 | #198 | Fair 97.7% |
| Immigrants | Ukraine | 22.7 /100 | #199 | Fair 97.7% |
| Immigrants | Albania | 22.6 /100 | #200 | Fair 97.7% |
| Immigrants | Lebanon | 21.7 /100 | #201 | Fair 97.7% |
| Immigrants | Southern Europe | 17.7 /100 | #202 | Poor 97.6% |
| Paiute | 16.7 /100 | #203 | Poor 97.6% |
| Immigrants | Chile | 16.5 /100 | #204 | Poor 97.6% |
| Africans | 14.5 /100 | #205 | Poor 97.6% |
| Immigrants | Northern Africa | 13.0 /100 | #206 | Poor 97.6% |
| Tohono O'odham | 12.5 /100 | #207 | Poor 97.6% |
| Immigrants | Zaire | 11.9 /100 | #208 | Poor 97.6% |
| Costa Ricans | 9.6 /100 | #209 | Tragic 97.6% |
| Immigrants | Oceania | 9.5 /100 | #210 | Tragic 97.6% |
| Laotians | 9.4 /100 | #211 | Tragic 97.6% |