Immigrants from North America vs Immigrants from Chile 3rd Grade
COMPARE
Immigrants from North America
Immigrants from Chile
3rd Grade
3rd Grade Comparison
Immigrants from North America
Immigrants from Chile
98.2%
3RD GRADE
99.7/ 100
METRIC RATING
63rd/ 347
METRIC RANK
97.6%
3RD GRADE
16.5/ 100
METRIC RATING
204th/ 347
METRIC RANK
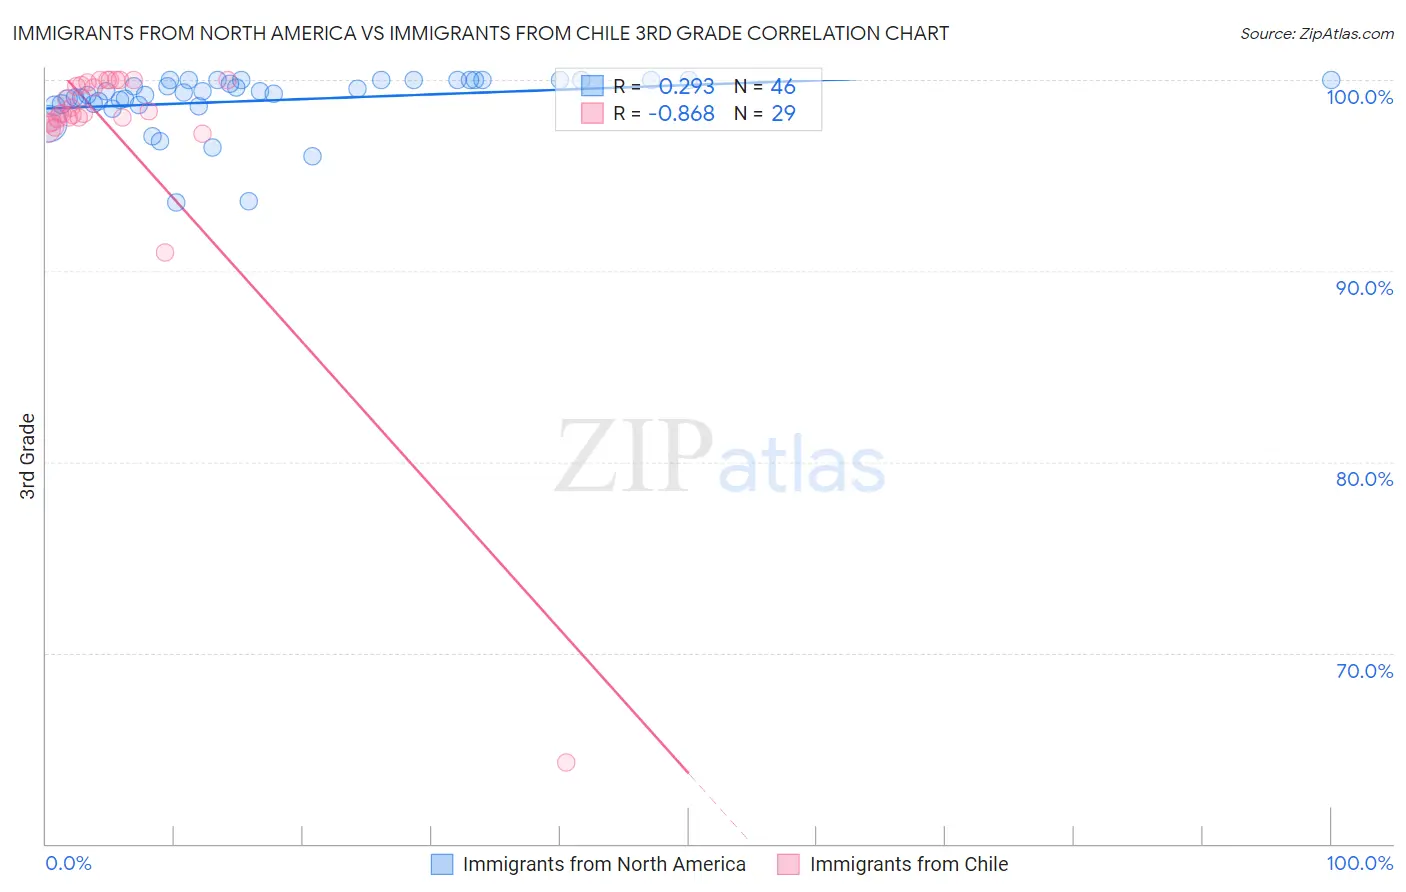
Immigrants from North America vs Immigrants from Chile 3rd Grade Correlation Chart
The statistical analysis conducted on geographies consisting of 462,462,400 people shows a weak positive correlation between the proportion of Immigrants from North America and percentage of population with at least 3rd grade education in the United States with a correlation coefficient (R) of 0.293 and weighted average of 98.2%. Similarly, the statistical analysis conducted on geographies consisting of 218,647,266 people shows a very strong negative correlation between the proportion of Immigrants from Chile and percentage of population with at least 3rd grade education in the United States with a correlation coefficient (R) of -0.868 and weighted average of 97.6%, a difference of 0.63%.
3rd Grade Correlation Summary
| Measurement | Immigrants from North America | Immigrants from Chile |
| Minimum | 93.6% | 64.3% |
| Maximum | 100.0% | 100.0% |
| Range | 6.4% | 35.7% |
| Mean | 98.9% | 97.3% |
| Median | 99.4% | 98.2% |
| Interquartile 25% (IQ1) | 98.7% | 97.9% |
| Interquartile 75% (IQ3) | 100.0% | 99.9% |
| Interquartile Range (IQR) | 1.3% | 2.0% |
| Standard Deviation (Sample) | 1.5% | 6.6% |
| Standard Deviation (Population) | 1.5% | 6.5% |
Similar Demographics by 3rd Grade
Demographics Similar to Immigrants from North America by 3rd Grade
In terms of 3rd grade, the demographic groups most similar to Immigrants from North America are Greek (98.3%, a difference of 0.010%), Maltese (98.3%, a difference of 0.010%), Creek (98.2%, a difference of 0.010%), Pueblo (98.2%, a difference of 0.010%), and Immigrants from Canada (98.2%, a difference of 0.010%).
| Demographics | Rating | Rank | 3rd Grade |
| Austrians | 99.8 /100 | #56 | Exceptional 98.3% |
| Slavs | 99.7 /100 | #57 | Exceptional 98.3% |
| Greeks | 99.7 /100 | #58 | Exceptional 98.3% |
| Maltese | 99.7 /100 | #59 | Exceptional 98.3% |
| Creek | 99.7 /100 | #60 | Exceptional 98.2% |
| Pueblo | 99.7 /100 | #61 | Exceptional 98.2% |
| Immigrants | Canada | 99.7 /100 | #62 | Exceptional 98.2% |
| Immigrants | North America | 99.7 /100 | #63 | Exceptional 98.2% |
| Kiowa | 99.6 /100 | #64 | Exceptional 98.2% |
| New Zealanders | 99.6 /100 | #65 | Exceptional 98.2% |
| Serbians | 99.6 /100 | #66 | Exceptional 98.2% |
| Russians | 99.6 /100 | #67 | Exceptional 98.2% |
| Immigrants | Northern Europe | 99.6 /100 | #68 | Exceptional 98.2% |
| Canadians | 99.6 /100 | #69 | Exceptional 98.2% |
| Cajuns | 99.6 /100 | #70 | Exceptional 98.2% |
Demographics Similar to Immigrants from Chile by 3rd Grade
In terms of 3rd grade, the demographic groups most similar to Immigrants from Chile are Paiute (97.6%, a difference of 0.0%), Immigrants from Southern Europe (97.6%, a difference of 0.010%), African (97.6%, a difference of 0.010%), Immigrants from Northern Africa (97.6%, a difference of 0.020%), and Immigrants from Ukraine (97.7%, a difference of 0.030%).
| Demographics | Rating | Rank | 3rd Grade |
| Hawaiians | 25.7 /100 | #197 | Fair 97.7% |
| Guamanians/Chamorros | 23.6 /100 | #198 | Fair 97.7% |
| Immigrants | Ukraine | 22.7 /100 | #199 | Fair 97.7% |
| Immigrants | Albania | 22.6 /100 | #200 | Fair 97.7% |
| Immigrants | Lebanon | 21.7 /100 | #201 | Fair 97.7% |
| Immigrants | Southern Europe | 17.7 /100 | #202 | Poor 97.6% |
| Paiute | 16.7 /100 | #203 | Poor 97.6% |
| Immigrants | Chile | 16.5 /100 | #204 | Poor 97.6% |
| Africans | 14.5 /100 | #205 | Poor 97.6% |
| Immigrants | Northern Africa | 13.0 /100 | #206 | Poor 97.6% |
| Tohono O'odham | 12.5 /100 | #207 | Poor 97.6% |
| Immigrants | Zaire | 11.9 /100 | #208 | Poor 97.6% |
| Costa Ricans | 9.6 /100 | #209 | Tragic 97.6% |
| Immigrants | Oceania | 9.5 /100 | #210 | Tragic 97.6% |
| Laotians | 9.4 /100 | #211 | Tragic 97.6% |