Albanian vs Mexican American Indian College, 1 year or more
COMPARE
Albanian
Mexican American Indian
College, 1 year or more
College, 1 year or more Comparison
Albanians
Mexican American Indians
60.4%
COLLEGE, 1 YEAR OR MORE
77.8/ 100
METRIC RATING
151st/ 347
METRIC RANK
51.9%
COLLEGE, 1 YEAR OR MORE
0.0/ 100
METRIC RATING
306th/ 347
METRIC RANK
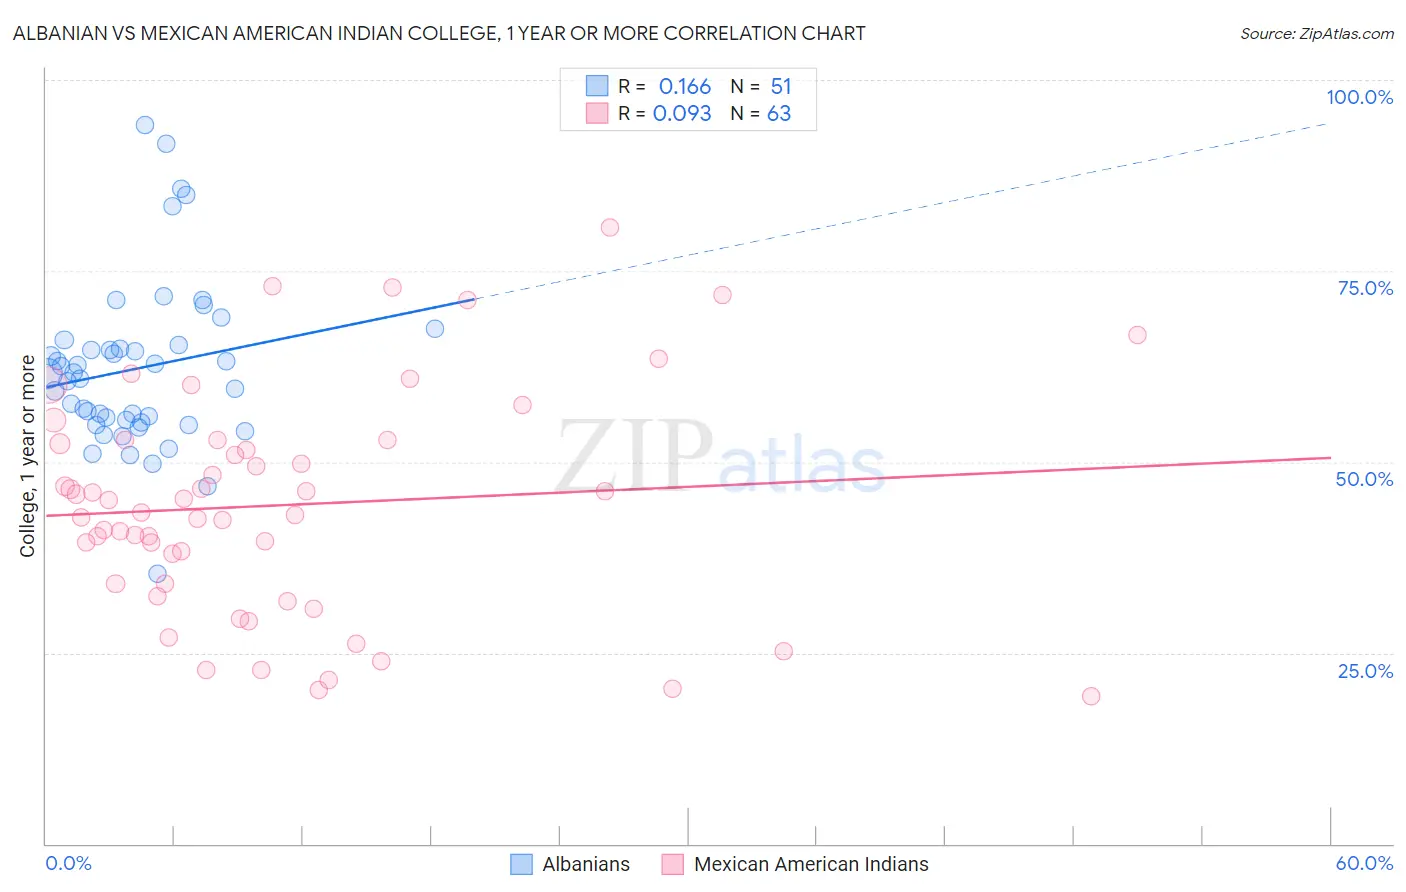
Albanian vs Mexican American Indian College, 1 year or more Correlation Chart
The statistical analysis conducted on geographies consisting of 193,265,709 people shows a poor positive correlation between the proportion of Albanians and percentage of population with at least college, 1 year or more education in the United States with a correlation coefficient (R) of 0.166 and weighted average of 60.4%. Similarly, the statistical analysis conducted on geographies consisting of 317,621,155 people shows a slight positive correlation between the proportion of Mexican American Indians and percentage of population with at least college, 1 year or more education in the United States with a correlation coefficient (R) of 0.093 and weighted average of 51.9%, a difference of 16.4%.
College, 1 year or more Correlation Summary
| Measurement | Albanian | Mexican American Indian |
| Minimum | 35.4% | 19.3% |
| Maximum | 94.1% | 80.8% |
| Range | 58.7% | 61.4% |
| Mean | 62.2% | 44.3% |
| Median | 61.5% | 43.4% |
| Interquartile 25% (IQ1) | 55.2% | 34.0% |
| Interquartile 75% (IQ3) | 65.3% | 52.8% |
| Interquartile Range (IQR) | 10.1% | 18.8% |
| Standard Deviation (Sample) | 11.0% | 14.6% |
| Standard Deviation (Population) | 10.9% | 14.5% |
Similar Demographics by College, 1 year or more
Demographics Similar to Albanians by College, 1 year or more
In terms of college, 1 year or more, the demographic groups most similar to Albanians are Immigrants from Sudan (60.4%, a difference of 0.0%), Kenyan (60.5%, a difference of 0.090%), Brazilian (60.5%, a difference of 0.090%), Immigrants from Kenya (60.5%, a difference of 0.10%), and Immigrants from Germany (60.3%, a difference of 0.13%).
| Demographics | Rating | Rank | College, 1 year or more |
| Czechs | 81.9 /100 | #144 | Excellent 60.6% |
| Slavs | 81.1 /100 | #145 | Excellent 60.6% |
| Scottish | 80.2 /100 | #146 | Excellent 60.5% |
| Immigrants | Kenya | 79.1 /100 | #147 | Good 60.5% |
| Kenyans | 79.0 /100 | #148 | Good 60.5% |
| Brazilians | 79.0 /100 | #149 | Good 60.5% |
| Immigrants | Sudan | 77.8 /100 | #150 | Good 60.4% |
| Albanians | 77.8 /100 | #151 | Good 60.4% |
| Immigrants | Germany | 76.1 /100 | #152 | Good 60.3% |
| Sierra Leoneans | 74.1 /100 | #153 | Good 60.2% |
| Sudanese | 73.0 /100 | #154 | Good 60.2% |
| Moroccans | 72.9 /100 | #155 | Good 60.2% |
| Finns | 72.9 /100 | #156 | Good 60.2% |
| Immigrants | Armenia | 68.8 /100 | #157 | Good 60.0% |
| English | 67.2 /100 | #158 | Good 60.0% |
Demographics Similar to Mexican American Indians by College, 1 year or more
In terms of college, 1 year or more, the demographic groups most similar to Mexican American Indians are Immigrants from Portugal (51.9%, a difference of 0.10%), Salvadoran (51.8%, a difference of 0.20%), Apache (51.8%, a difference of 0.22%), Seminole (52.1%, a difference of 0.33%), and Central American (52.1%, a difference of 0.43%).
| Demographics | Rating | Rank | College, 1 year or more |
| Immigrants | Nicaragua | 0.0 /100 | #299 | Tragic 52.4% |
| Choctaw | 0.0 /100 | #300 | Tragic 52.3% |
| Haitians | 0.0 /100 | #301 | Tragic 52.3% |
| Puerto Ricans | 0.0 /100 | #302 | Tragic 52.2% |
| Creek | 0.0 /100 | #303 | Tragic 52.2% |
| Central Americans | 0.0 /100 | #304 | Tragic 52.1% |
| Seminole | 0.0 /100 | #305 | Tragic 52.1% |
| Mexican American Indians | 0.0 /100 | #306 | Tragic 51.9% |
| Immigrants | Portugal | 0.0 /100 | #307 | Tragic 51.9% |
| Salvadorans | 0.0 /100 | #308 | Tragic 51.8% |
| Apache | 0.0 /100 | #309 | Tragic 51.8% |
| Hondurans | 0.0 /100 | #310 | Tragic 51.6% |
| Immigrants | Haiti | 0.0 /100 | #311 | Tragic 51.5% |
| Pueblo | 0.0 /100 | #312 | Tragic 51.5% |
| Immigrants | Caribbean | 0.0 /100 | #313 | Tragic 51.4% |