Albanian vs Immigrants from Cambodia 5th Grade
COMPARE
Albanian
Immigrants from Cambodia
5th Grade
5th Grade Comparison
Albanians
Immigrants from Cambodia
97.4%
5TH GRADE
68.3/ 100
METRIC RATING
158th/ 347
METRIC RANK
95.5%
5TH GRADE
0.0/ 100
METRIC RATING
326th/ 347
METRIC RANK
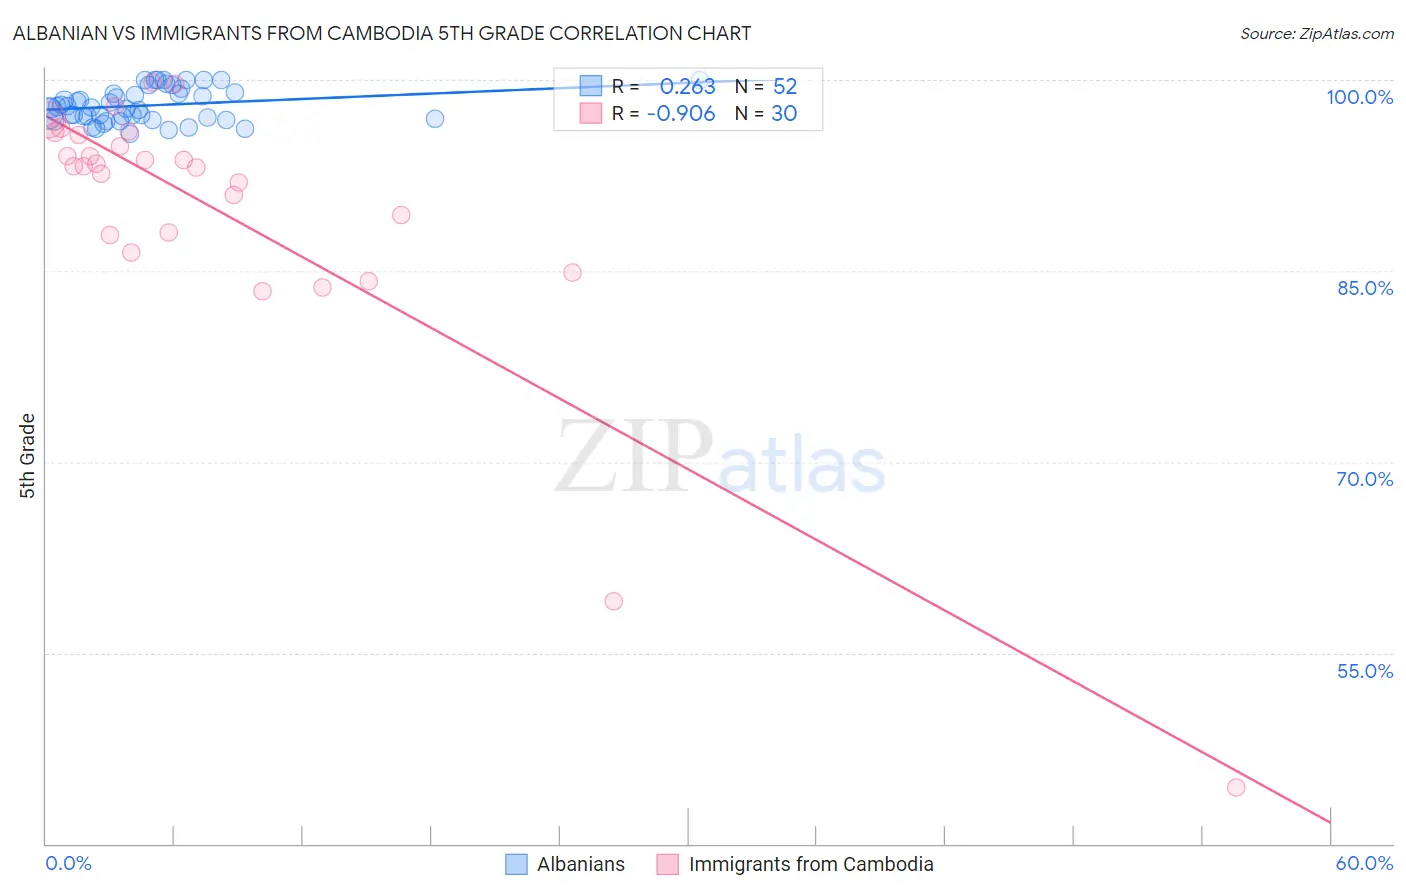
Albanian vs Immigrants from Cambodia 5th Grade Correlation Chart
The statistical analysis conducted on geographies consisting of 193,265,850 people shows a weak positive correlation between the proportion of Albanians and percentage of population with at least 5th grade education in the United States with a correlation coefficient (R) of 0.263 and weighted average of 97.4%. Similarly, the statistical analysis conducted on geographies consisting of 205,153,442 people shows a near-perfect negative correlation between the proportion of Immigrants from Cambodia and percentage of population with at least 5th grade education in the United States with a correlation coefficient (R) of -0.906 and weighted average of 95.5%, a difference of 1.9%.
5th Grade Correlation Summary
| Measurement | Albanian | Immigrants from Cambodia |
| Minimum | 95.8% | 44.4% |
| Maximum | 100.0% | 99.8% |
| Range | 4.2% | 55.4% |
| Mean | 98.0% | 89.6% |
| Median | 97.8% | 93.3% |
| Interquartile 25% (IQ1) | 97.0% | 87.8% |
| Interquartile 75% (IQ3) | 99.0% | 95.7% |
| Interquartile Range (IQR) | 2.0% | 7.9% |
| Standard Deviation (Sample) | 1.3% | 11.4% |
| Standard Deviation (Population) | 1.3% | 11.2% |
Similar Demographics by 5th Grade
Demographics Similar to Albanians by 5th Grade
In terms of 5th grade, the demographic groups most similar to Albanians are Immigrants from Russia (97.4%, a difference of 0.010%), Immigrants from Bosnia and Herzegovina (97.4%, a difference of 0.010%), French American Indian (97.4%, a difference of 0.010%), Immigrants from Jordan (97.4%, a difference of 0.010%), and Immigrants from Italy (97.4%, a difference of 0.010%).
| Demographics | Rating | Rank | 5th Grade |
| Immigrants | Eastern Europe | 75.0 /100 | #151 | Good 97.4% |
| Ute | 74.9 /100 | #152 | Good 97.4% |
| Alsatians | 74.3 /100 | #153 | Good 97.4% |
| Immigrants | Russia | 71.2 /100 | #154 | Good 97.4% |
| Immigrants | Bosnia and Herzegovina | 71.0 /100 | #155 | Good 97.4% |
| French American Indians | 70.5 /100 | #156 | Good 97.4% |
| Immigrants | Jordan | 70.4 /100 | #157 | Good 97.4% |
| Albanians | 68.3 /100 | #158 | Good 97.4% |
| Immigrants | Italy | 65.2 /100 | #159 | Good 97.4% |
| Marshallese | 61.2 /100 | #160 | Good 97.4% |
| Kenyans | 59.7 /100 | #161 | Average 97.4% |
| Immigrants | Iran | 59.5 /100 | #162 | Average 97.4% |
| Ugandans | 58.9 /100 | #163 | Average 97.4% |
| Bermudans | 58.8 /100 | #164 | Average 97.4% |
| Immigrants | Poland | 57.9 /100 | #165 | Average 97.4% |
Demographics Similar to Immigrants from Cambodia by 5th Grade
In terms of 5th grade, the demographic groups most similar to Immigrants from Cambodia are Dominican (95.5%, a difference of 0.0%), Honduran (95.6%, a difference of 0.030%), Hispanic or Latino (95.6%, a difference of 0.030%), Cape Verdean (95.5%, a difference of 0.030%), and Mexican American Indian (95.5%, a difference of 0.040%).
| Demographics | Rating | Rank | 5th Grade |
| Japanese | 0.0 /100 | #319 | Tragic 95.7% |
| Central American Indians | 0.0 /100 | #320 | Tragic 95.7% |
| Immigrants | Belize | 0.0 /100 | #321 | Tragic 95.7% |
| Immigrants | Nicaragua | 0.0 /100 | #322 | Tragic 95.6% |
| Immigrants | Fiji | 0.0 /100 | #323 | Tragic 95.6% |
| Hondurans | 0.0 /100 | #324 | Tragic 95.6% |
| Hispanics or Latinos | 0.0 /100 | #325 | Tragic 95.6% |
| Immigrants | Cambodia | 0.0 /100 | #326 | Tragic 95.5% |
| Dominicans | 0.0 /100 | #327 | Tragic 95.5% |
| Cape Verdeans | 0.0 /100 | #328 | Tragic 95.5% |
| Mexican American Indians | 0.0 /100 | #329 | Tragic 95.5% |
| Immigrants | Armenia | 0.0 /100 | #330 | Tragic 95.4% |
| Immigrants | Honduras | 0.0 /100 | #331 | Tragic 95.4% |
| Immigrants | Dominican Republic | 0.0 /100 | #332 | Tragic 95.3% |
| Immigrants | Latin America | 0.0 /100 | #333 | Tragic 95.3% |