Guamanian/Chamorro vs Immigrants from Cambodia 5th Grade
COMPARE
Guamanian/Chamorro
Immigrants from Cambodia
5th Grade
5th Grade Comparison
Guamanians/Chamorros
Immigrants from Cambodia
97.2%
5TH GRADE
26.8/ 100
METRIC RATING
195th/ 347
METRIC RANK
95.5%
5TH GRADE
0.0/ 100
METRIC RATING
326th/ 347
METRIC RANK
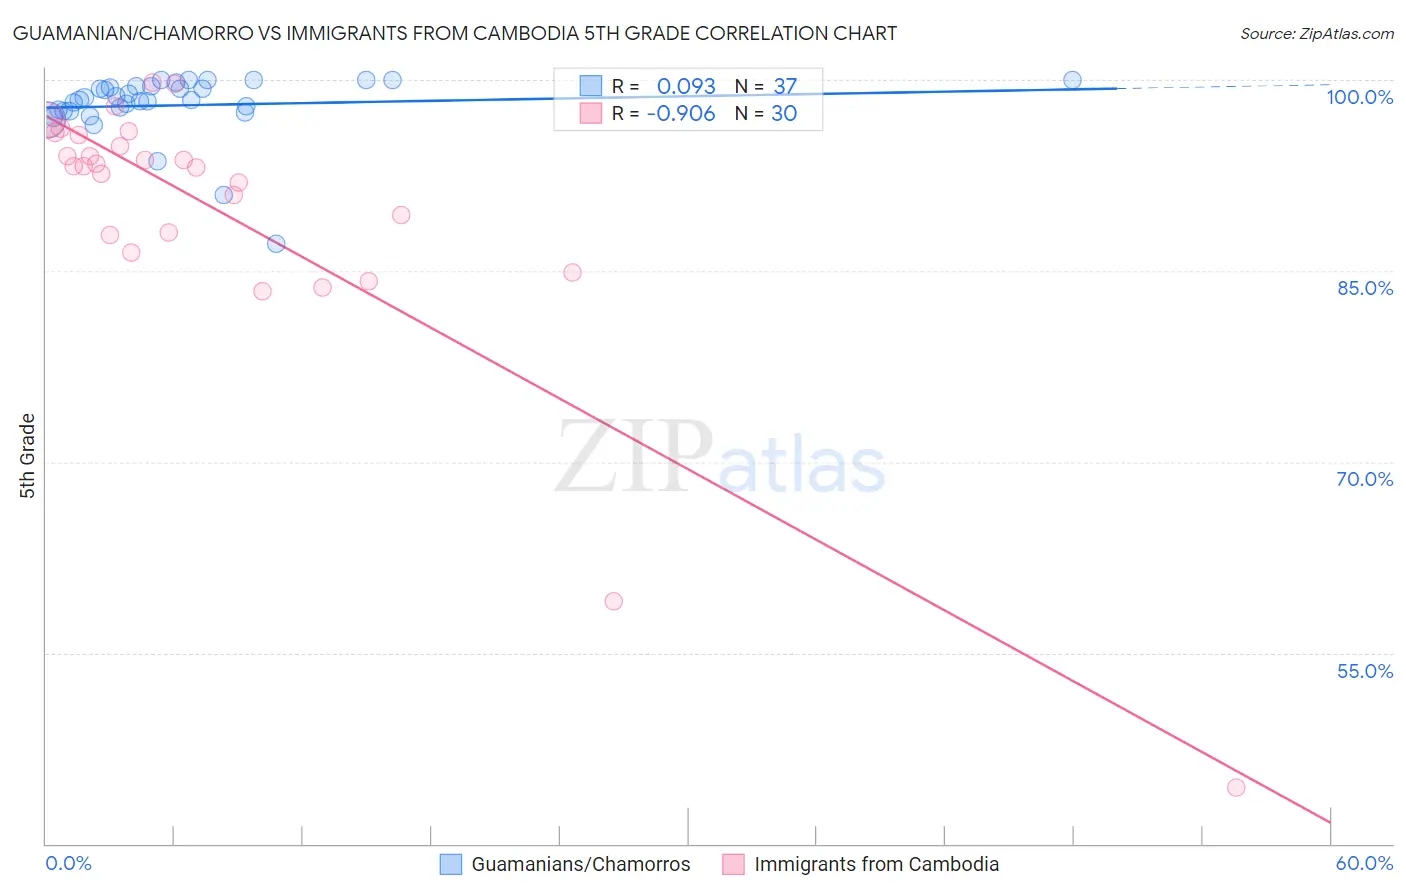
Guamanian/Chamorro vs Immigrants from Cambodia 5th Grade Correlation Chart
The statistical analysis conducted on geographies consisting of 221,965,618 people shows a slight positive correlation between the proportion of Guamanians/Chamorros and percentage of population with at least 5th grade education in the United States with a correlation coefficient (R) of 0.093 and weighted average of 97.2%. Similarly, the statistical analysis conducted on geographies consisting of 205,153,442 people shows a near-perfect negative correlation between the proportion of Immigrants from Cambodia and percentage of population with at least 5th grade education in the United States with a correlation coefficient (R) of -0.906 and weighted average of 95.5%, a difference of 1.8%.
5th Grade Correlation Summary
| Measurement | Guamanian/Chamorro | Immigrants from Cambodia |
| Minimum | 87.2% | 44.4% |
| Maximum | 100.0% | 99.8% |
| Range | 12.8% | 55.4% |
| Mean | 98.0% | 89.6% |
| Median | 98.5% | 93.3% |
| Interquartile 25% (IQ1) | 97.5% | 87.8% |
| Interquartile 75% (IQ3) | 99.5% | 95.7% |
| Interquartile Range (IQR) | 2.0% | 7.9% |
| Standard Deviation (Sample) | 2.6% | 11.4% |
| Standard Deviation (Population) | 2.5% | 11.2% |
Similar Demographics by 5th Grade
Demographics Similar to Guamanians/Chamorros by 5th Grade
In terms of 5th grade, the demographic groups most similar to Guamanians/Chamorros are Navajo (97.2%, a difference of 0.010%), Immigrants from Albania (97.2%, a difference of 0.010%), Hawaiian (97.2%, a difference of 0.010%), Brazilian (97.2%, a difference of 0.010%), and Immigrants from Brazil (97.3%, a difference of 0.020%).
| Demographics | Rating | Rank | 5th Grade |
| Paraguayans | 33.7 /100 | #188 | Fair 97.3% |
| Immigrants | Egypt | 32.9 /100 | #189 | Fair 97.3% |
| Blacks/African Americans | 31.8 /100 | #190 | Fair 97.3% |
| Immigrants | Brazil | 31.5 /100 | #191 | Fair 97.3% |
| Panamanians | 31.3 /100 | #192 | Fair 97.3% |
| Navajo | 29.0 /100 | #193 | Fair 97.2% |
| Immigrants | Albania | 28.5 /100 | #194 | Fair 97.2% |
| Guamanians/Chamorros | 26.8 /100 | #195 | Fair 97.2% |
| Hawaiians | 25.6 /100 | #196 | Fair 97.2% |
| Brazilians | 25.4 /100 | #197 | Fair 97.2% |
| Immigrants | Uganda | 21.1 /100 | #198 | Fair 97.2% |
| Natives/Alaskans | 18.0 /100 | #199 | Poor 97.2% |
| Immigrants | Northern Africa | 16.8 /100 | #200 | Poor 97.2% |
| Immigrants | Chile | 16.6 /100 | #201 | Poor 97.2% |
| Africans | 15.3 /100 | #202 | Poor 97.2% |
Demographics Similar to Immigrants from Cambodia by 5th Grade
In terms of 5th grade, the demographic groups most similar to Immigrants from Cambodia are Dominican (95.5%, a difference of 0.0%), Honduran (95.6%, a difference of 0.030%), Hispanic or Latino (95.6%, a difference of 0.030%), Cape Verdean (95.5%, a difference of 0.030%), and Mexican American Indian (95.5%, a difference of 0.040%).
| Demographics | Rating | Rank | 5th Grade |
| Japanese | 0.0 /100 | #319 | Tragic 95.7% |
| Central American Indians | 0.0 /100 | #320 | Tragic 95.7% |
| Immigrants | Belize | 0.0 /100 | #321 | Tragic 95.7% |
| Immigrants | Nicaragua | 0.0 /100 | #322 | Tragic 95.6% |
| Immigrants | Fiji | 0.0 /100 | #323 | Tragic 95.6% |
| Hondurans | 0.0 /100 | #324 | Tragic 95.6% |
| Hispanics or Latinos | 0.0 /100 | #325 | Tragic 95.6% |
| Immigrants | Cambodia | 0.0 /100 | #326 | Tragic 95.5% |
| Dominicans | 0.0 /100 | #327 | Tragic 95.5% |
| Cape Verdeans | 0.0 /100 | #328 | Tragic 95.5% |
| Mexican American Indians | 0.0 /100 | #329 | Tragic 95.5% |
| Immigrants | Armenia | 0.0 /100 | #330 | Tragic 95.4% |
| Immigrants | Honduras | 0.0 /100 | #331 | Tragic 95.4% |
| Immigrants | Dominican Republic | 0.0 /100 | #332 | Tragic 95.3% |
| Immigrants | Latin America | 0.0 /100 | #333 | Tragic 95.3% |