Albanian vs New Zealander 5th Grade
COMPARE
Albanian
New Zealander
5th Grade
5th Grade Comparison
Albanians
New Zealanders
97.4%
5TH GRADE
68.3/ 100
METRIC RATING
158th/ 347
METRIC RANK
97.9%
5TH GRADE
99.6/ 100
METRIC RATING
67th/ 347
METRIC RANK
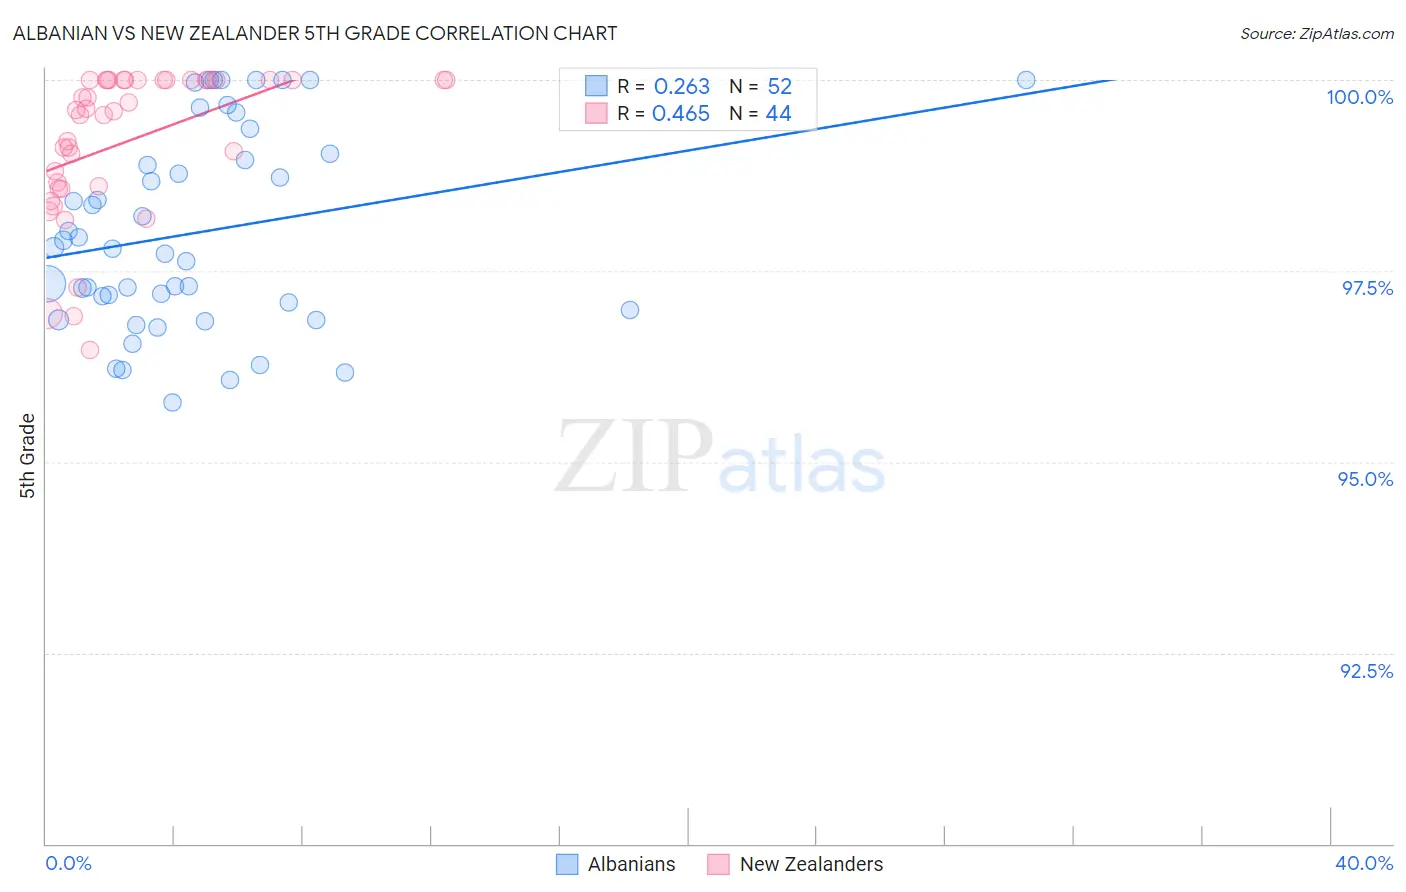
Albanian vs New Zealander 5th Grade Correlation Chart
The statistical analysis conducted on geographies consisting of 193,265,850 people shows a weak positive correlation between the proportion of Albanians and percentage of population with at least 5th grade education in the United States with a correlation coefficient (R) of 0.263 and weighted average of 97.4%. Similarly, the statistical analysis conducted on geographies consisting of 106,912,544 people shows a moderate positive correlation between the proportion of New Zealanders and percentage of population with at least 5th grade education in the United States with a correlation coefficient (R) of 0.465 and weighted average of 97.9%, a difference of 0.50%.
5th Grade Correlation Summary
| Measurement | Albanian | New Zealander |
| Minimum | 95.8% | 96.5% |
| Maximum | 100.0% | 100.0% |
| Range | 4.2% | 3.5% |
| Mean | 98.0% | 99.2% |
| Median | 97.8% | 99.6% |
| Interquartile 25% (IQ1) | 97.0% | 98.6% |
| Interquartile 75% (IQ3) | 99.0% | 100.0% |
| Interquartile Range (IQR) | 2.0% | 1.4% |
| Standard Deviation (Sample) | 1.3% | 0.96% |
| Standard Deviation (Population) | 1.3% | 0.95% |
Similar Demographics by 5th Grade
Demographics Similar to Albanians by 5th Grade
In terms of 5th grade, the demographic groups most similar to Albanians are Immigrants from Russia (97.4%, a difference of 0.010%), Immigrants from Bosnia and Herzegovina (97.4%, a difference of 0.010%), French American Indian (97.4%, a difference of 0.010%), Immigrants from Jordan (97.4%, a difference of 0.010%), and Immigrants from Italy (97.4%, a difference of 0.010%).
| Demographics | Rating | Rank | 5th Grade |
| Immigrants | Eastern Europe | 75.0 /100 | #151 | Good 97.4% |
| Ute | 74.9 /100 | #152 | Good 97.4% |
| Alsatians | 74.3 /100 | #153 | Good 97.4% |
| Immigrants | Russia | 71.2 /100 | #154 | Good 97.4% |
| Immigrants | Bosnia and Herzegovina | 71.0 /100 | #155 | Good 97.4% |
| French American Indians | 70.5 /100 | #156 | Good 97.4% |
| Immigrants | Jordan | 70.4 /100 | #157 | Good 97.4% |
| Albanians | 68.3 /100 | #158 | Good 97.4% |
| Immigrants | Italy | 65.2 /100 | #159 | Good 97.4% |
| Marshallese | 61.2 /100 | #160 | Good 97.4% |
| Kenyans | 59.7 /100 | #161 | Average 97.4% |
| Immigrants | Iran | 59.5 /100 | #162 | Average 97.4% |
| Ugandans | 58.9 /100 | #163 | Average 97.4% |
| Bermudans | 58.8 /100 | #164 | Average 97.4% |
| Immigrants | Poland | 57.9 /100 | #165 | Average 97.4% |
Demographics Similar to New Zealanders by 5th Grade
In terms of 5th grade, the demographic groups most similar to New Zealanders are Canadian (97.9%, a difference of 0.0%), Immigrants from Austria (97.9%, a difference of 0.0%), Immigrants from Northern Europe (97.9%, a difference of 0.010%), Cajun (97.9%, a difference of 0.010%), and Russian (97.9%, a difference of 0.020%).
| Demographics | Rating | Rank | 5th Grade |
| Immigrants | Canada | 99.7 /100 | #60 | Exceptional 97.9% |
| Serbians | 99.7 /100 | #61 | Exceptional 97.9% |
| Immigrants | North America | 99.7 /100 | #62 | Exceptional 97.9% |
| Russians | 99.7 /100 | #63 | Exceptional 97.9% |
| Immigrants | Northern Europe | 99.6 /100 | #64 | Exceptional 97.9% |
| Canadians | 99.6 /100 | #65 | Exceptional 97.9% |
| Immigrants | Austria | 99.6 /100 | #66 | Exceptional 97.9% |
| New Zealanders | 99.6 /100 | #67 | Exceptional 97.9% |
| Cajuns | 99.6 /100 | #68 | Exceptional 97.9% |
| Kiowa | 99.5 /100 | #69 | Exceptional 97.9% |
| Iranians | 99.5 /100 | #70 | Exceptional 97.9% |
| Chickasaw | 99.5 /100 | #71 | Exceptional 97.9% |
| Macedonians | 99.4 /100 | #72 | Exceptional 97.9% |
| Cherokee | 99.4 /100 | #73 | Exceptional 97.8% |
| Lumbee | 99.3 /100 | #74 | Exceptional 97.8% |