Albanian vs Carpatho Rusyn 3rd Grade
COMPARE
Albanian
Carpatho Rusyn
3rd Grade
3rd Grade Comparison
Albanians
Carpatho Rusyns
97.8%
3RD GRADE
58.8/ 100
METRIC RATING
161st/ 347
METRIC RANK
98.5%
3RD GRADE
100.0/ 100
METRIC RATING
14th/ 347
METRIC RANK
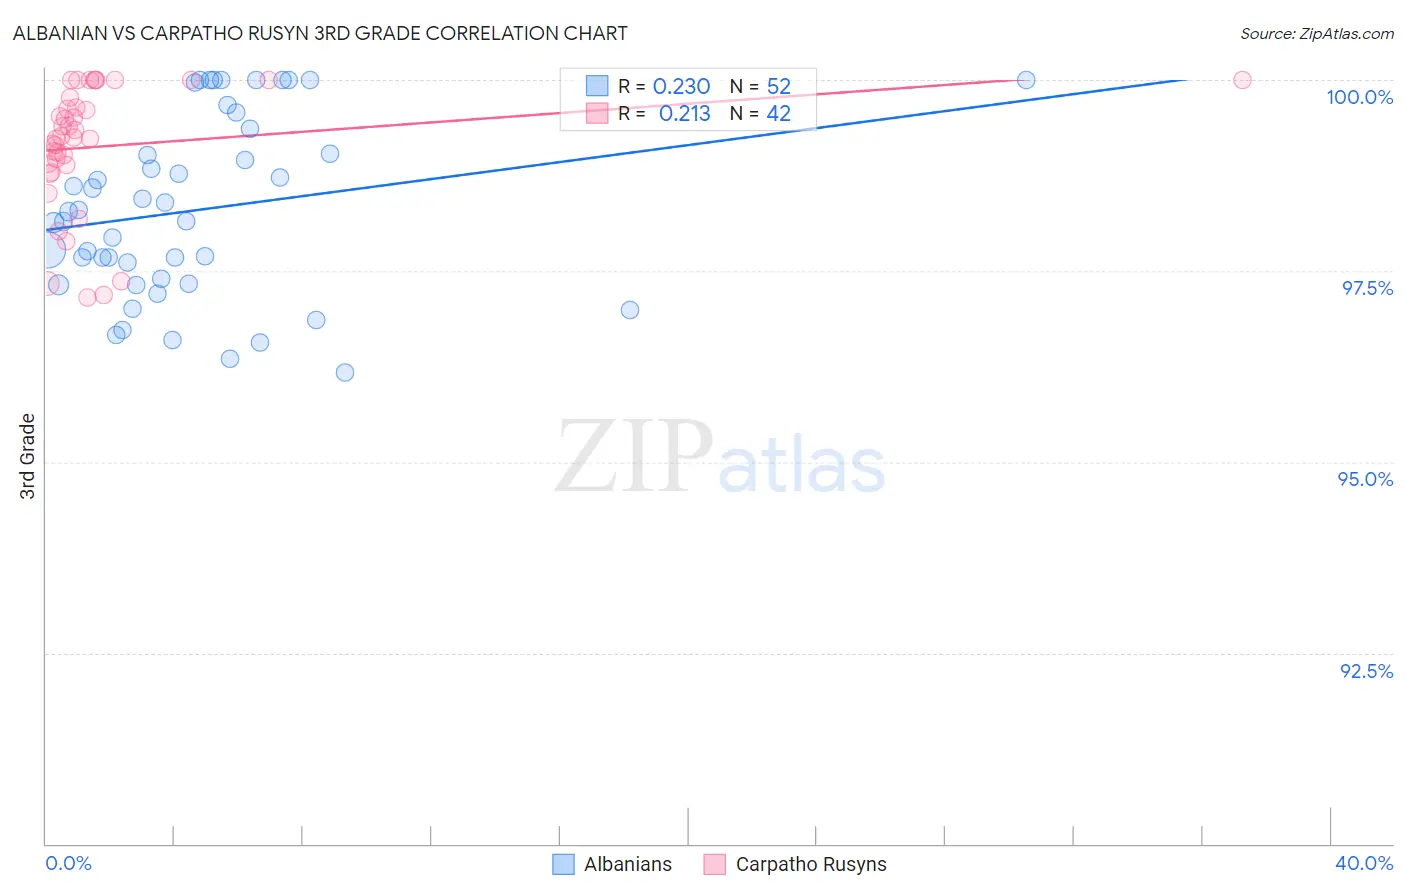
Albanian vs Carpatho Rusyn 3rd Grade Correlation Chart
The statistical analysis conducted on geographies consisting of 193,265,850 people shows a weak positive correlation between the proportion of Albanians and percentage of population with at least 3rd grade education in the United States with a correlation coefficient (R) of 0.230 and weighted average of 97.8%. Similarly, the statistical analysis conducted on geographies consisting of 58,871,690 people shows a weak positive correlation between the proportion of Carpatho Rusyns and percentage of population with at least 3rd grade education in the United States with a correlation coefficient (R) of 0.213 and weighted average of 98.5%, a difference of 0.78%.
3rd Grade Correlation Summary
| Measurement | Albanian | Carpatho Rusyn |
| Minimum | 96.2% | 97.2% |
| Maximum | 100.0% | 100.0% |
| Range | 3.8% | 2.8% |
| Mean | 98.3% | 99.1% |
| Median | 98.2% | 99.3% |
| Interquartile 25% (IQ1) | 97.4% | 98.9% |
| Interquartile 75% (IQ3) | 99.2% | 99.8% |
| Interquartile Range (IQR) | 1.8% | 0.88% |
| Standard Deviation (Sample) | 1.2% | 0.82% |
| Standard Deviation (Population) | 1.2% | 0.81% |
Similar Demographics by 3rd Grade
Demographics Similar to Albanians by 3rd Grade
In terms of 3rd grade, the demographic groups most similar to Albanians are French American Indian (97.8%, a difference of 0.0%), Immigrants from Iran (97.8%, a difference of 0.0%), Immigrants from Jordan (97.8%, a difference of 0.0%), Bermudan (97.8%, a difference of 0.010%), and Immigrants from Russia (97.8%, a difference of 0.010%).
| Demographics | Rating | Rank | 3rd Grade |
| Immigrants | Eastern Europe | 64.1 /100 | #154 | Good 97.8% |
| Bermudans | 62.6 /100 | #155 | Good 97.8% |
| Immigrants | Russia | 61.7 /100 | #156 | Good 97.8% |
| Immigrants | Italy | 61.2 /100 | #157 | Good 97.8% |
| Venezuelans | 60.9 /100 | #158 | Good 97.8% |
| French American Indians | 60.0 /100 | #159 | Average 97.8% |
| Immigrants | Iran | 59.1 /100 | #160 | Average 97.8% |
| Albanians | 58.8 /100 | #161 | Average 97.8% |
| Immigrants | Jordan | 57.9 /100 | #162 | Average 97.8% |
| Marshallese | 57.2 /100 | #163 | Average 97.8% |
| Immigrants | Bosnia and Herzegovina | 56.2 /100 | #164 | Average 97.8% |
| Ugandans | 56.1 /100 | #165 | Average 97.8% |
| Dutch West Indians | 55.5 /100 | #166 | Average 97.8% |
| Chileans | 55.3 /100 | #167 | Average 97.8% |
| Immigrants | Spain | 54.3 /100 | #168 | Average 97.8% |
Demographics Similar to Carpatho Rusyns by 3rd Grade
In terms of 3rd grade, the demographic groups most similar to Carpatho Rusyns are English (98.6%, a difference of 0.0%), Tlingit-Haida (98.5%, a difference of 0.0%), Swedish (98.5%, a difference of 0.010%), Slovene (98.6%, a difference of 0.020%), and Alaska Native (98.6%, a difference of 0.030%).
| Demographics | Rating | Rank | 3rd Grade |
| Norwegians | 100.0 /100 | #7 | Exceptional 98.6% |
| Slovaks | 100.0 /100 | #8 | Exceptional 98.6% |
| Germans | 100.0 /100 | #9 | Exceptional 98.6% |
| Alaska Natives | 100.0 /100 | #10 | Exceptional 98.6% |
| Slovenes | 100.0 /100 | #11 | Exceptional 98.6% |
| English | 100.0 /100 | #12 | Exceptional 98.6% |
| Tlingit-Haida | 100.0 /100 | #13 | Exceptional 98.5% |
| Carpatho Rusyns | 100.0 /100 | #14 | Exceptional 98.5% |
| Swedes | 100.0 /100 | #15 | Exceptional 98.5% |
| Scottish | 100.0 /100 | #16 | Exceptional 98.5% |
| Dutch | 100.0 /100 | #17 | Exceptional 98.5% |
| Irish | 100.0 /100 | #18 | Exceptional 98.5% |
| Poles | 100.0 /100 | #19 | Exceptional 98.5% |
| Pennsylvania Germans | 100.0 /100 | #20 | Exceptional 98.5% |
| Lithuanians | 100.0 /100 | #21 | Exceptional 98.5% |