Alaskan Athabascan vs Immigrants from Peru College, 1 year or more
COMPARE
Alaskan Athabascan
Immigrants from Peru
College, 1 year or more
College, 1 year or more Comparison
Alaskan Athabascans
Immigrants from Peru
53.4%
COLLEGE, 1 YEAR OR MORE
0.0/ 100
METRIC RATING
290th/ 347
METRIC RANK
57.7%
COLLEGE, 1 YEAR OR MORE
10.6/ 100
METRIC RATING
216th/ 347
METRIC RANK
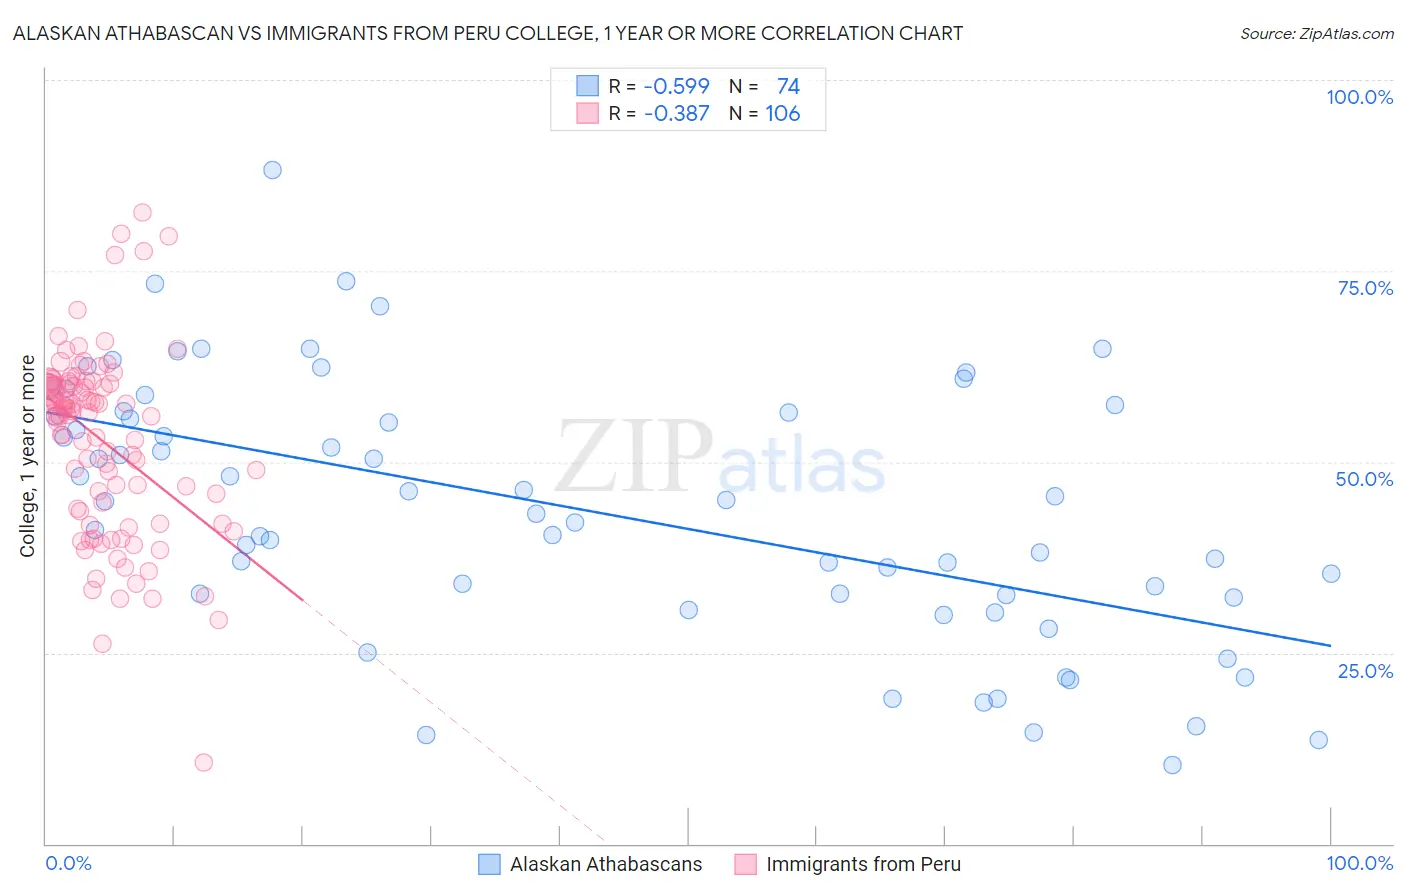
Alaskan Athabascan vs Immigrants from Peru College, 1 year or more Correlation Chart
The statistical analysis conducted on geographies consisting of 45,820,330 people shows a substantial negative correlation between the proportion of Alaskan Athabascans and percentage of population with at least college, 1 year or more education in the United States with a correlation coefficient (R) of -0.599 and weighted average of 53.4%. Similarly, the statistical analysis conducted on geographies consisting of 328,860,288 people shows a mild negative correlation between the proportion of Immigrants from Peru and percentage of population with at least college, 1 year or more education in the United States with a correlation coefficient (R) of -0.387 and weighted average of 57.7%, a difference of 8.1%.
College, 1 year or more Correlation Summary
| Measurement | Alaskan Athabascan | Immigrants from Peru |
| Minimum | 10.3% | 10.6% |
| Maximum | 88.2% | 82.6% |
| Range | 77.9% | 72.0% |
| Mean | 43.6% | 52.8% |
| Median | 44.1% | 56.3% |
| Interquartile 25% (IQ1) | 32.5% | 43.5% |
| Interquartile 75% (IQ3) | 56.5% | 60.2% |
| Interquartile Range (IQR) | 24.0% | 16.7% |
| Standard Deviation (Sample) | 16.8% | 12.2% |
| Standard Deviation (Population) | 16.7% | 12.1% |
Similar Demographics by College, 1 year or more
Demographics Similar to Alaskan Athabascans by College, 1 year or more
In terms of college, 1 year or more, the demographic groups most similar to Alaskan Athabascans are Alaska Native (53.4%, a difference of 0.020%), Immigrants from Ecuador (53.4%, a difference of 0.020%), Cuban (53.4%, a difference of 0.050%), Chickasaw (53.3%, a difference of 0.18%), and Immigrants from Belize (53.5%, a difference of 0.19%).
| Demographics | Rating | Rank | College, 1 year or more |
| Nicaraguans | 0.1 /100 | #283 | Tragic 53.9% |
| Ute | 0.1 /100 | #284 | Tragic 53.8% |
| Immigrants | Guyana | 0.1 /100 | #285 | Tragic 53.5% |
| Central American Indians | 0.1 /100 | #286 | Tragic 53.5% |
| Immigrants | Belize | 0.1 /100 | #287 | Tragic 53.5% |
| Alaska Natives | 0.0 /100 | #288 | Tragic 53.4% |
| Immigrants | Ecuador | 0.0 /100 | #289 | Tragic 53.4% |
| Alaskan Athabascans | 0.0 /100 | #290 | Tragic 53.4% |
| Cubans | 0.0 /100 | #291 | Tragic 53.4% |
| Chickasaw | 0.0 /100 | #292 | Tragic 53.3% |
| Blacks/African Americans | 0.0 /100 | #293 | Tragic 53.3% |
| Cherokee | 0.0 /100 | #294 | Tragic 53.2% |
| Yaqui | 0.0 /100 | #295 | Tragic 53.2% |
| Sioux | 0.0 /100 | #296 | Tragic 53.0% |
| Paiute | 0.0 /100 | #297 | Tragic 52.9% |
Demographics Similar to Immigrants from Peru by College, 1 year or more
In terms of college, 1 year or more, the demographic groups most similar to Immigrants from Peru are Tongan (57.8%, a difference of 0.13%), Immigrants from Colombia (57.8%, a difference of 0.14%), Immigrants from Senegal (57.8%, a difference of 0.17%), French Canadian (57.8%, a difference of 0.17%), and Immigrants from Panama (57.6%, a difference of 0.24%).
| Demographics | Rating | Rank | College, 1 year or more |
| Immigrants | Middle Africa | 14.0 /100 | #209 | Poor 58.0% |
| Tsimshian | 13.5 /100 | #210 | Poor 57.9% |
| Immigrants | Nigeria | 13.3 /100 | #211 | Poor 57.9% |
| Immigrants | Senegal | 11.8 /100 | #212 | Poor 57.8% |
| French Canadians | 11.8 /100 | #213 | Poor 57.8% |
| Immigrants | Colombia | 11.6 /100 | #214 | Poor 57.8% |
| Tongans | 11.6 /100 | #215 | Poor 57.8% |
| Immigrants | Peru | 10.6 /100 | #216 | Poor 57.7% |
| Immigrants | Panama | 9.1 /100 | #217 | Tragic 57.6% |
| Native Hawaiians | 9.0 /100 | #218 | Tragic 57.6% |
| Whites/Caucasians | 8.7 /100 | #219 | Tragic 57.6% |
| Immigrants | Costa Rica | 8.0 /100 | #220 | Tragic 57.5% |
| Immigrants | Ghana | 7.7 /100 | #221 | Tragic 57.4% |
| Sub-Saharan Africans | 6.1 /100 | #222 | Tragic 57.3% |
| Portuguese | 5.4 /100 | #223 | Tragic 57.2% |