Alaskan Athabascan vs Nicaraguan Associate's Degree
COMPARE
Alaskan Athabascan
Nicaraguan
Associate's Degree
Associate's Degree Comparison
Alaskan Athabascans
Nicaraguans
36.5%
ASSOCIATE'S DEGREE
0.0/ 100
METRIC RATING
328th/ 347
METRIC RANK
41.5%
ASSOCIATE'S DEGREE
0.4/ 100
METRIC RATING
261st/ 347
METRIC RANK
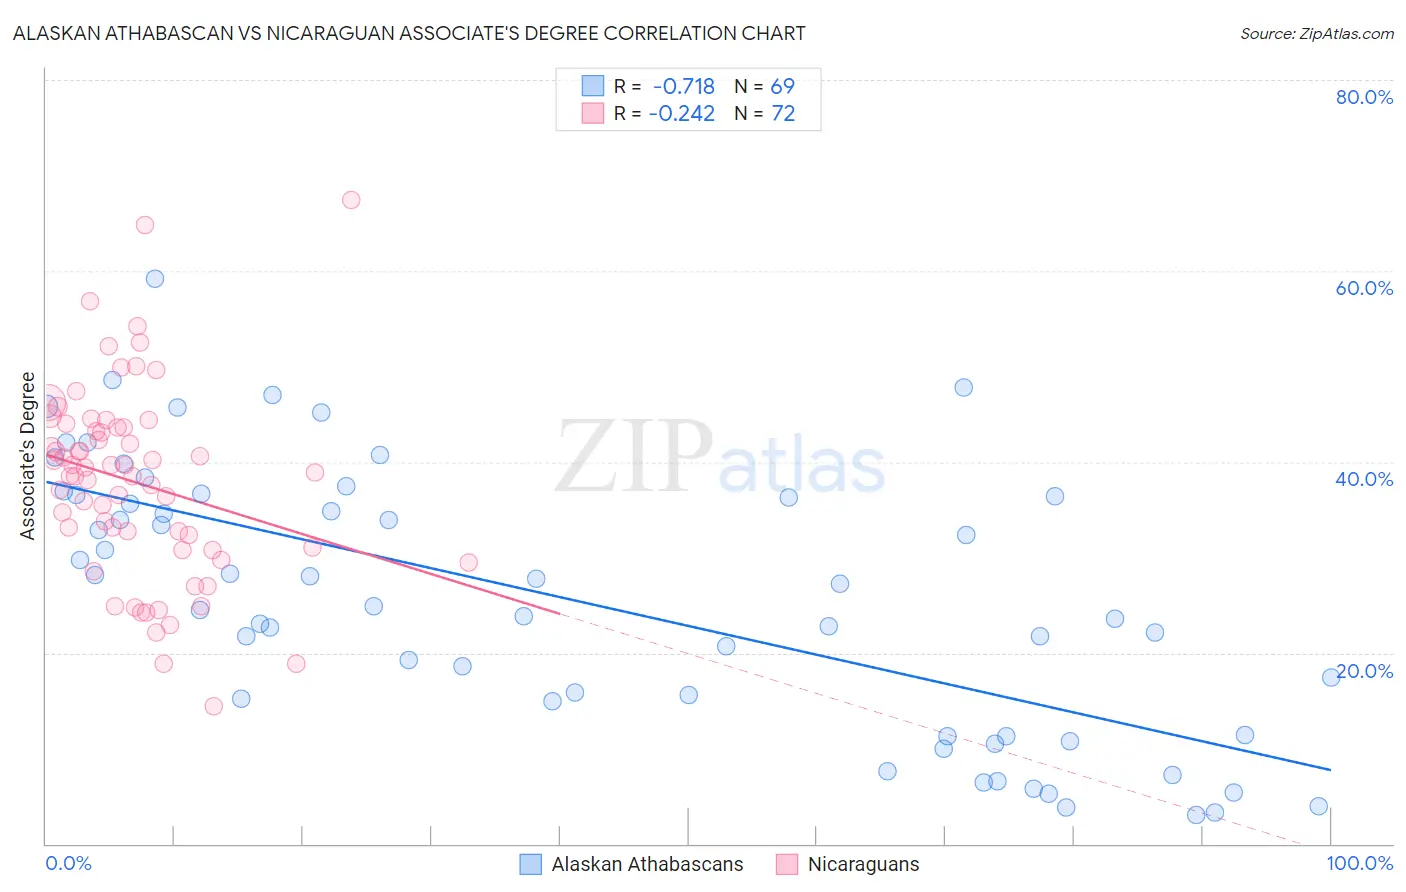
Alaskan Athabascan vs Nicaraguan Associate's Degree Correlation Chart
The statistical analysis conducted on geographies consisting of 45,819,945 people shows a strong negative correlation between the proportion of Alaskan Athabascans and percentage of population with at least associate's degree education in the United States with a correlation coefficient (R) of -0.718 and weighted average of 36.5%. Similarly, the statistical analysis conducted on geographies consisting of 285,707,386 people shows a weak negative correlation between the proportion of Nicaraguans and percentage of population with at least associate's degree education in the United States with a correlation coefficient (R) of -0.242 and weighted average of 41.5%, a difference of 13.8%.
Associate's Degree Correlation Summary
| Measurement | Alaskan Athabascan | Nicaraguan |
| Minimum | 3.0% | 14.4% |
| Maximum | 59.2% | 67.4% |
| Range | 56.2% | 53.0% |
| Mean | 25.6% | 37.8% |
| Median | 24.9% | 38.7% |
| Interquartile 25% (IQ1) | 13.2% | 30.9% |
| Interquartile 75% (IQ3) | 36.5% | 43.6% |
| Interquartile Range (IQR) | 23.3% | 12.7% |
| Standard Deviation (Sample) | 13.9% | 10.2% |
| Standard Deviation (Population) | 13.8% | 10.1% |
Similar Demographics by Associate's Degree
Demographics Similar to Alaskan Athabascans by Associate's Degree
In terms of associate's degree, the demographic groups most similar to Alaskan Athabascans are Dutch West Indian (36.5%, a difference of 0.010%), Kiowa (36.5%, a difference of 0.030%), Paiute (36.4%, a difference of 0.29%), Menominee (36.7%, a difference of 0.59%), and Apache (36.2%, a difference of 0.60%).
| Demographics | Rating | Rank | Associate's Degree |
| Immigrants | Yemen | 0.0 /100 | #321 | Tragic 37.3% |
| Pennsylvania Germans | 0.0 /100 | #322 | Tragic 37.2% |
| Immigrants | Cabo Verde | 0.0 /100 | #323 | Tragic 36.8% |
| Arapaho | 0.0 /100 | #324 | Tragic 36.7% |
| Menominee | 0.0 /100 | #325 | Tragic 36.7% |
| Kiowa | 0.0 /100 | #326 | Tragic 36.5% |
| Dutch West Indians | 0.0 /100 | #327 | Tragic 36.5% |
| Alaskan Athabascans | 0.0 /100 | #328 | Tragic 36.5% |
| Paiute | 0.0 /100 | #329 | Tragic 36.4% |
| Apache | 0.0 /100 | #330 | Tragic 36.2% |
| Immigrants | Azores | 0.0 /100 | #331 | Tragic 35.6% |
| Immigrants | Central America | 0.0 /100 | #332 | Tragic 35.0% |
| Mexicans | 0.0 /100 | #333 | Tragic 35.0% |
| Natives/Alaskans | 0.0 /100 | #334 | Tragic 34.9% |
| Spanish American Indians | 0.0 /100 | #335 | Tragic 34.9% |
Demographics Similar to Nicaraguans by Associate's Degree
In terms of associate's degree, the demographic groups most similar to Nicaraguans are Bahamian (41.5%, a difference of 0.090%), Immigrants from Jamaica (41.5%, a difference of 0.11%), Osage (41.5%, a difference of 0.12%), Marshallese (41.6%, a difference of 0.13%), and Malaysian (41.6%, a difference of 0.32%).
| Demographics | Rating | Rank | Associate's Degree |
| Cubans | 0.6 /100 | #254 | Tragic 41.9% |
| Immigrants | Guyana | 0.5 /100 | #255 | Tragic 41.8% |
| Immigrants | Congo | 0.5 /100 | #256 | Tragic 41.8% |
| Spanish Americans | 0.5 /100 | #257 | Tragic 41.8% |
| Japanese | 0.5 /100 | #258 | Tragic 41.7% |
| Malaysians | 0.4 /100 | #259 | Tragic 41.6% |
| Marshallese | 0.4 /100 | #260 | Tragic 41.6% |
| Nicaraguans | 0.4 /100 | #261 | Tragic 41.5% |
| Bahamians | 0.4 /100 | #262 | Tragic 41.5% |
| Immigrants | Jamaica | 0.3 /100 | #263 | Tragic 41.5% |
| Osage | 0.3 /100 | #264 | Tragic 41.5% |
| Africans | 0.2 /100 | #265 | Tragic 41.1% |
| Samoans | 0.2 /100 | #266 | Tragic 41.1% |
| Hawaiians | 0.2 /100 | #267 | Tragic 40.9% |
| Central American Indians | 0.2 /100 | #268 | Tragic 40.8% |