Alaskan Athabascan vs Cheyenne Nursery School
COMPARE
Alaskan Athabascan
Cheyenne
Nursery School
Nursery School Comparison
Alaskan Athabascans
Cheyenne
98.8%
NURSERY SCHOOL
100.0/ 100
METRIC RATING
6th/ 347
METRIC RANK
98.4%
NURSERY SCHOOL
99.6/ 100
METRIC RATING
70th/ 347
METRIC RANK
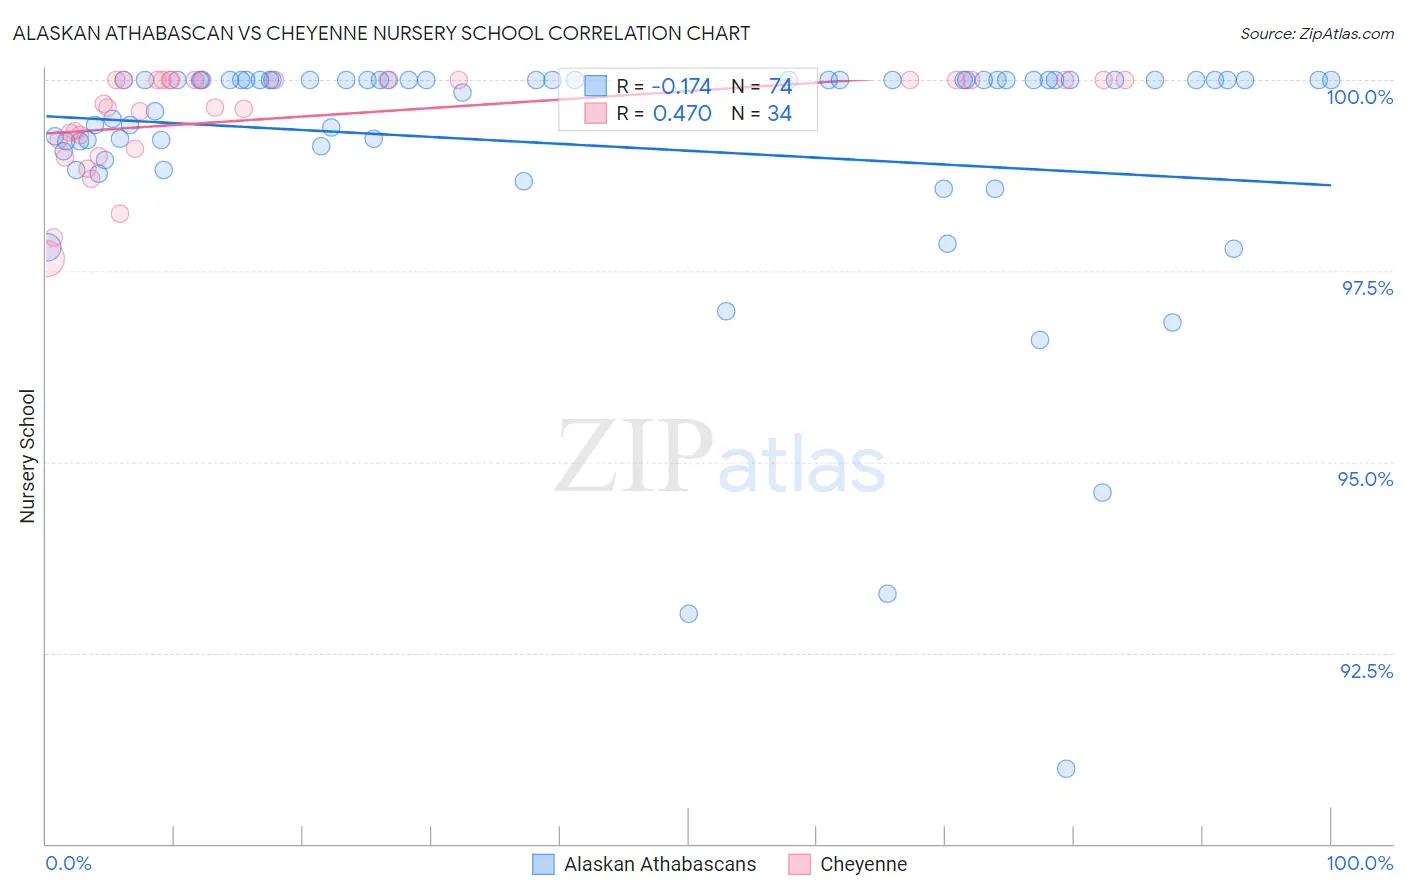
Alaskan Athabascan vs Cheyenne Nursery School Correlation Chart
The statistical analysis conducted on geographies consisting of 45,820,365 people shows a poor negative correlation between the proportion of Alaskan Athabascans and percentage of population with at least nursery school education in the United States with a correlation coefficient (R) of -0.174 and weighted average of 98.8%. Similarly, the statistical analysis conducted on geographies consisting of 80,719,411 people shows a moderate positive correlation between the proportion of Cheyenne and percentage of population with at least nursery school education in the United States with a correlation coefficient (R) of 0.470 and weighted average of 98.4%, a difference of 0.41%.
Nursery School Correlation Summary
| Measurement | Alaskan Athabascan | Cheyenne |
| Minimum | 91.0% | 97.7% |
| Maximum | 100.0% | 100.0% |
| Range | 9.0% | 2.3% |
| Mean | 99.1% | 99.5% |
| Median | 100.0% | 99.8% |
| Interquartile 25% (IQ1) | 99.1% | 99.2% |
| Interquartile 75% (IQ3) | 100.0% | 100.0% |
| Interquartile Range (IQR) | 0.87% | 0.79% |
| Standard Deviation (Sample) | 1.7% | 0.64% |
| Standard Deviation (Population) | 1.7% | 0.63% |
Similar Demographics by Nursery School
Demographics Similar to Alaskan Athabascans by Nursery School
In terms of nursery school, the demographic groups most similar to Alaskan Athabascans are Alaska Native (98.8%, a difference of 0.030%), Norwegian (98.7%, a difference of 0.060%), Tsimshian (98.9%, a difference of 0.070%), Slovak (98.7%, a difference of 0.070%), and German (98.7%, a difference of 0.070%).
| Demographics | Rating | Rank | Nursery School |
| Crow | 100.0 /100 | #1 | Exceptional 99.7% |
| Yup'ik | 100.0 /100 | #2 | Exceptional 99.2% |
| Welsh | 100.0 /100 | #3 | Exceptional 98.9% |
| Inupiat | 100.0 /100 | #4 | Exceptional 98.9% |
| Tsimshian | 100.0 /100 | #5 | Exceptional 98.9% |
| Alaskan Athabascans | 100.0 /100 | #6 | Exceptional 98.8% |
| Alaska Natives | 100.0 /100 | #7 | Exceptional 98.8% |
| Norwegians | 100.0 /100 | #8 | Exceptional 98.7% |
| Slovaks | 100.0 /100 | #9 | Exceptional 98.7% |
| Germans | 100.0 /100 | #10 | Exceptional 98.7% |
| Tlingit-Haida | 100.0 /100 | #11 | Exceptional 98.7% |
| Slovenes | 100.0 /100 | #12 | Exceptional 98.7% |
| English | 100.0 /100 | #13 | Exceptional 98.7% |
| Carpatho Rusyns | 100.0 /100 | #14 | Exceptional 98.7% |
| Swedes | 100.0 /100 | #15 | Exceptional 98.7% |
Demographics Similar to Cheyenne by Nursery School
In terms of nursery school, the demographic groups most similar to Cheyenne are Immigrants from Northern Europe (98.4%, a difference of 0.0%), Russian (98.4%, a difference of 0.0%), Immigrants from Austria (98.4%, a difference of 0.0%), Serbian (98.4%, a difference of 0.0%), and Canadian (98.4%, a difference of 0.010%).
| Demographics | Rating | Rank | Nursery School |
| Immigrants | North America | 99.7 /100 | #63 | Exceptional 98.4% |
| Greeks | 99.7 /100 | #64 | Exceptional 98.4% |
| Maltese | 99.7 /100 | #65 | Exceptional 98.4% |
| Canadians | 99.7 /100 | #66 | Exceptional 98.4% |
| Immigrants | Northern Europe | 99.6 /100 | #67 | Exceptional 98.4% |
| Russians | 99.6 /100 | #68 | Exceptional 98.4% |
| Immigrants | Austria | 99.6 /100 | #69 | Exceptional 98.4% |
| Cheyenne | 99.6 /100 | #70 | Exceptional 98.4% |
| Serbians | 99.6 /100 | #71 | Exceptional 98.4% |
| Chickasaw | 99.6 /100 | #72 | Exceptional 98.4% |
| Cajuns | 99.4 /100 | #73 | Exceptional 98.4% |
| Immigrants | Netherlands | 99.4 /100 | #74 | Exceptional 98.4% |
| Cherokee | 99.3 /100 | #75 | Exceptional 98.3% |
| Immigrants | England | 99.3 /100 | #76 | Exceptional 98.3% |
| Immigrants | Lithuania | 99.3 /100 | #77 | Exceptional 98.3% |