Immigrants from Northern Africa vs Immigrants from North Macedonia Kindergarten
COMPARE
Immigrants from Northern Africa
Immigrants from North Macedonia
Kindergarten
Kindergarten Comparison
Immigrants from Northern Africa
Immigrants from North Macedonia
97.8%
KINDERGARTEN
12.0/ 100
METRIC RATING
208th/ 347
METRIC RANK
98.0%
KINDERGARTEN
66.4/ 100
METRIC RATING
157th/ 347
METRIC RANK
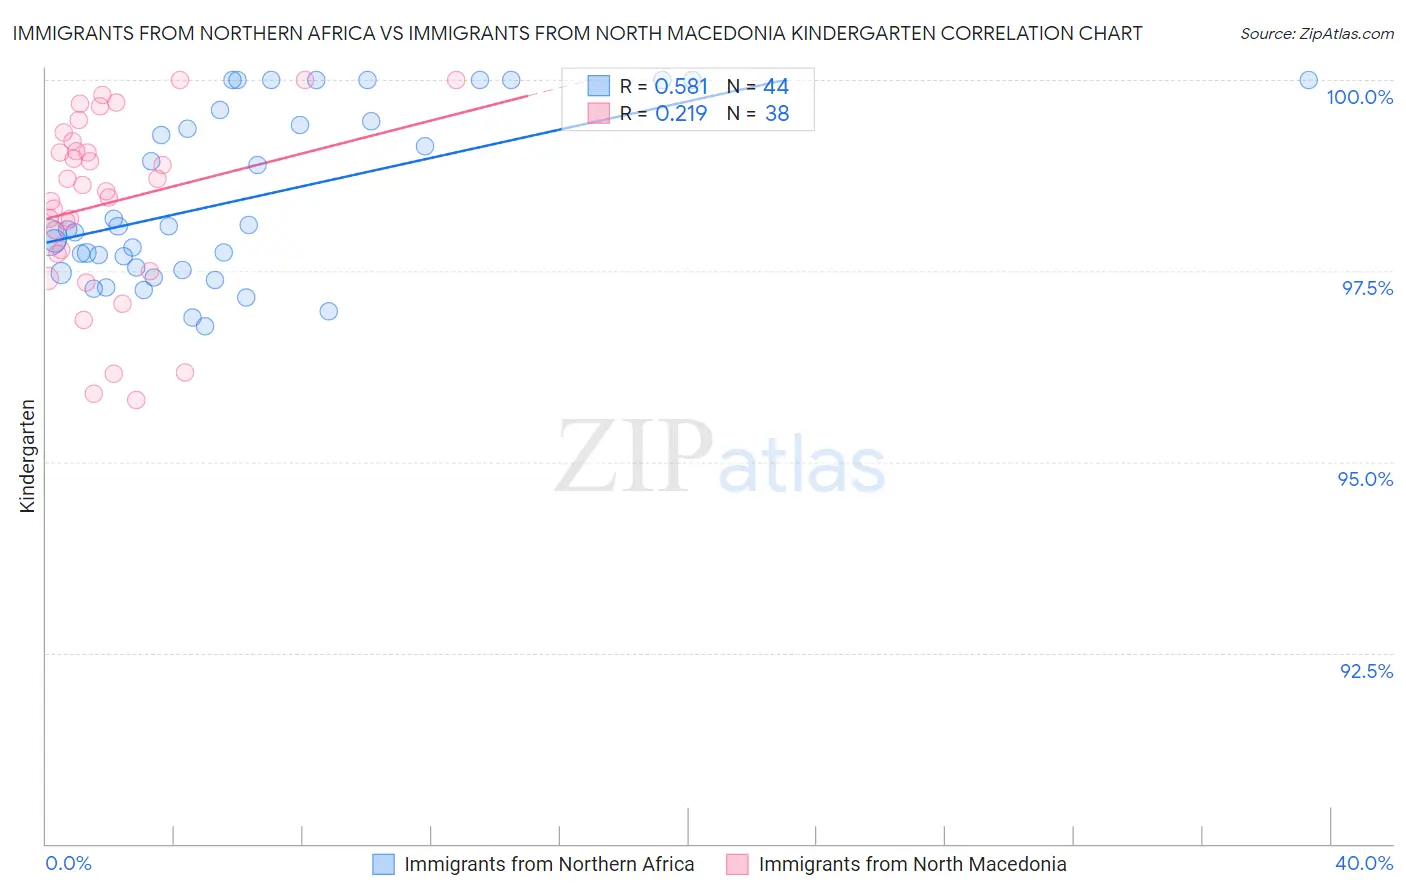
Immigrants from Northern Africa vs Immigrants from North Macedonia Kindergarten Correlation Chart
The statistical analysis conducted on geographies consisting of 321,196,768 people shows a substantial positive correlation between the proportion of Immigrants from Northern Africa and percentage of population with at least kindergarten education in the United States with a correlation coefficient (R) of 0.581 and weighted average of 97.8%. Similarly, the statistical analysis conducted on geographies consisting of 74,317,186 people shows a weak positive correlation between the proportion of Immigrants from North Macedonia and percentage of population with at least kindergarten education in the United States with a correlation coefficient (R) of 0.219 and weighted average of 98.0%, a difference of 0.21%.
Kindergarten Correlation Summary
| Measurement | Immigrants from Northern Africa | Immigrants from North Macedonia |
| Minimum | 96.8% | 95.8% |
| Maximum | 100.0% | 100.0% |
| Range | 3.2% | 4.2% |
| Mean | 98.4% | 98.4% |
| Median | 98.1% | 98.6% |
| Interquartile 25% (IQ1) | 97.5% | 97.7% |
| Interquartile 75% (IQ3) | 99.5% | 99.2% |
| Interquartile Range (IQR) | 2.0% | 1.5% |
| Standard Deviation (Sample) | 1.1% | 1.2% |
| Standard Deviation (Population) | 1.1% | 1.2% |
Similar Demographics by Kindergarten
Demographics Similar to Immigrants from Northern Africa by Kindergarten
In terms of kindergarten, the demographic groups most similar to Immigrants from Northern Africa are Costa Rican (97.8%, a difference of 0.0%), Immigrants from Oceania (97.8%, a difference of 0.010%), Laotian (97.8%, a difference of 0.010%), Immigrants from Albania (97.8%, a difference of 0.030%), and African (97.8%, a difference of 0.030%).
| Demographics | Rating | Rank | Kindergarten |
| Immigrants | Lebanon | 20.9 /100 | #201 | Fair 97.9% |
| Immigrants | Ukraine | 19.1 /100 | #202 | Poor 97.8% |
| Immigrants | Uganda | 18.8 /100 | #203 | Poor 97.8% |
| Immigrants | Chile | 18.1 /100 | #204 | Poor 97.8% |
| Immigrants | Southern Europe | 18.0 /100 | #205 | Poor 97.8% |
| Immigrants | Albania | 16.4 /100 | #206 | Poor 97.8% |
| Africans | 16.1 /100 | #207 | Poor 97.8% |
| Immigrants | Northern Africa | 12.0 /100 | #208 | Poor 97.8% |
| Costa Ricans | 11.6 /100 | #209 | Poor 97.8% |
| Immigrants | Oceania | 11.1 /100 | #210 | Poor 97.8% |
| Laotians | 10.5 /100 | #211 | Poor 97.8% |
| Moroccans | 8.9 /100 | #212 | Tragic 97.8% |
| South American Indians | 7.7 /100 | #213 | Tragic 97.8% |
| Uruguayans | 7.5 /100 | #214 | Tragic 97.8% |
| Immigrants | Bahamas | 7.4 /100 | #215 | Tragic 97.8% |
Demographics Similar to Immigrants from North Macedonia by Kindergarten
In terms of kindergarten, the demographic groups most similar to Immigrants from North Macedonia are Immigrants from South Central Asia (98.0%, a difference of 0.0%), Dutch West Indian (98.0%, a difference of 0.010%), Immigrants from Moldova (98.0%, a difference of 0.010%), Immigrants from Iran (98.0%, a difference of 0.010%), and Comanche (98.0%, a difference of 0.010%).
| Demographics | Rating | Rank | Kindergarten |
| Jordanians | 72.8 /100 | #150 | Good 98.0% |
| Soviet Union | 70.8 /100 | #151 | Good 98.0% |
| Dutch West Indians | 70.1 /100 | #152 | Good 98.0% |
| Immigrants | Moldova | 69.1 /100 | #153 | Good 98.0% |
| Immigrants | Iran | 68.8 /100 | #154 | Good 98.0% |
| Comanche | 68.3 /100 | #155 | Good 98.0% |
| Immigrants | South Central Asia | 66.6 /100 | #156 | Good 98.0% |
| Immigrants | North Macedonia | 66.4 /100 | #157 | Good 98.0% |
| Venezuelans | 64.7 /100 | #158 | Good 98.0% |
| French American Indians | 63.7 /100 | #159 | Good 98.0% |
| Immigrants | Russia | 59.0 /100 | #160 | Average 98.0% |
| Immigrants | Eastern Europe | 59.0 /100 | #161 | Average 98.0% |
| Immigrants | Italy | 58.9 /100 | #162 | Average 98.0% |
| Spanish Americans | 57.8 /100 | #163 | Average 98.0% |
| Immigrants | Micronesia | 57.7 /100 | #164 | Average 98.0% |