Pima vs Fijian 5th Grade
COMPARE
Pima
Fijian
5th Grade
5th Grade Comparison
Pima
Fijians
97.6%
5TH GRADE
91.2/ 100
METRIC RATING
131st/ 347
METRIC RANK
96.6%
5TH GRADE
0.1/ 100
METRIC RATING
283rd/ 347
METRIC RANK
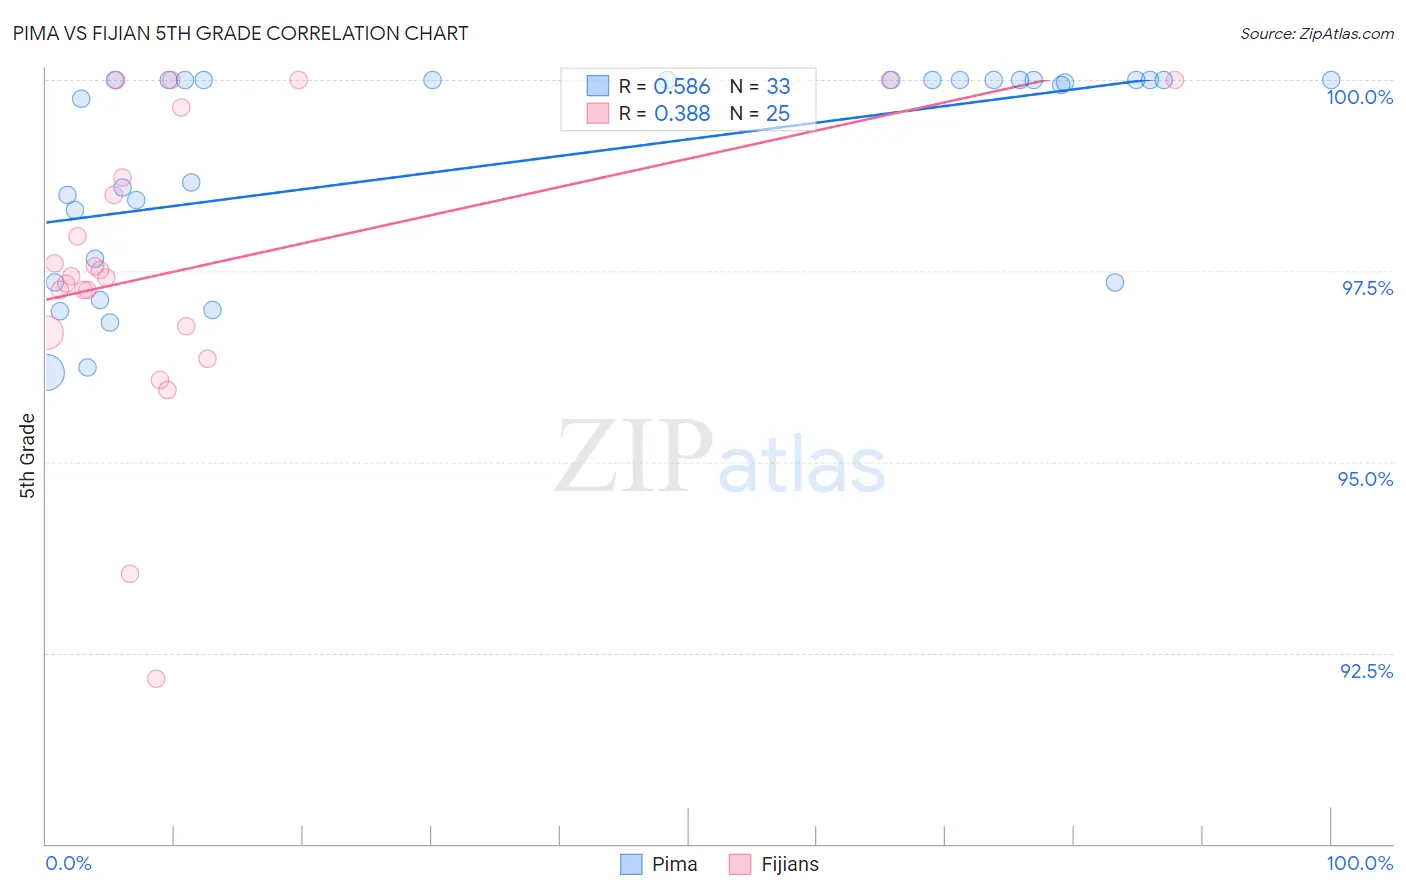
Pima vs Fijian 5th Grade Correlation Chart
The statistical analysis conducted on geographies consisting of 61,552,136 people shows a substantial positive correlation between the proportion of Pima and percentage of population with at least 5th grade education in the United States with a correlation coefficient (R) of 0.586 and weighted average of 97.6%. Similarly, the statistical analysis conducted on geographies consisting of 55,948,842 people shows a mild positive correlation between the proportion of Fijians and percentage of population with at least 5th grade education in the United States with a correlation coefficient (R) of 0.388 and weighted average of 96.6%, a difference of 0.99%.
5th Grade Correlation Summary
| Measurement | Pima | Fijian |
| Minimum | 96.2% | 92.2% |
| Maximum | 100.0% | 100.0% |
| Range | 3.8% | 7.8% |
| Mean | 98.9% | 97.6% |
| Median | 100.0% | 97.4% |
| Interquartile 25% (IQ1) | 97.5% | 96.7% |
| Interquartile 75% (IQ3) | 100.0% | 99.2% |
| Interquartile Range (IQR) | 2.5% | 2.4% |
| Standard Deviation (Sample) | 1.4% | 1.9% |
| Standard Deviation (Population) | 1.3% | 1.9% |
Similar Demographics by 5th Grade
Demographics Similar to Pima by 5th Grade
In terms of 5th grade, the demographic groups most similar to Pima are Immigrants from Serbia (97.6%, a difference of 0.010%), Colville (97.6%, a difference of 0.010%), Immigrants from Europe (97.6%, a difference of 0.010%), Immigrants from Romania (97.6%, a difference of 0.010%), and Immigrants from Kuwait (97.6%, a difference of 0.010%).
| Demographics | Rating | Rank | 5th Grade |
| Spanish | 93.7 /100 | #124 | Exceptional 97.6% |
| Immigrants | Bulgaria | 93.1 /100 | #125 | Exceptional 97.6% |
| Hmong | 92.3 /100 | #126 | Exceptional 97.6% |
| Immigrants | Serbia | 92.3 /100 | #127 | Exceptional 97.6% |
| Colville | 92.0 /100 | #128 | Exceptional 97.6% |
| Immigrants | Europe | 91.9 /100 | #129 | Exceptional 97.6% |
| Immigrants | Romania | 91.6 /100 | #130 | Exceptional 97.6% |
| Pima | 91.2 /100 | #131 | Exceptional 97.6% |
| Immigrants | Kuwait | 90.4 /100 | #132 | Exceptional 97.6% |
| Cambodians | 90.2 /100 | #133 | Exceptional 97.6% |
| Immigrants | Hungary | 90.1 /100 | #134 | Exceptional 97.6% |
| Palestinians | 89.3 /100 | #135 | Excellent 97.5% |
| Immigrants | Moldova | 87.5 /100 | #136 | Excellent 97.5% |
| Filipinos | 86.8 /100 | #137 | Excellent 97.5% |
| Blackfeet | 86.8 /100 | #138 | Excellent 97.5% |
Demographics Similar to Fijians by 5th Grade
In terms of 5th grade, the demographic groups most similar to Fijians are Immigrants from Western Africa (96.6%, a difference of 0.0%), Houma (96.6%, a difference of 0.0%), Barbadian (96.6%, a difference of 0.0%), Immigrants from Trinidad and Tobago (96.6%, a difference of 0.0%), and Immigrants from Philippines (96.6%, a difference of 0.010%).
| Demographics | Rating | Rank | 5th Grade |
| Cubans | 0.1 /100 | #276 | Tragic 96.6% |
| Immigrants | Bolivia | 0.1 /100 | #277 | Tragic 96.6% |
| Immigrants | Ghana | 0.1 /100 | #278 | Tragic 96.6% |
| Immigrants | Philippines | 0.1 /100 | #279 | Tragic 96.6% |
| Immigrants | Western Africa | 0.1 /100 | #280 | Tragic 96.6% |
| Houma | 0.1 /100 | #281 | Tragic 96.6% |
| Barbadians | 0.1 /100 | #282 | Tragic 96.6% |
| Fijians | 0.1 /100 | #283 | Tragic 96.6% |
| Immigrants | Trinidad and Tobago | 0.1 /100 | #284 | Tragic 96.6% |
| Immigrants | St. Vincent and the Grenadines | 0.1 /100 | #285 | Tragic 96.6% |
| Immigrants | Thailand | 0.1 /100 | #286 | Tragic 96.6% |
| Immigrants | Afghanistan | 0.1 /100 | #287 | Tragic 96.6% |
| Immigrants | Barbados | 0.0 /100 | #288 | Tragic 96.6% |
| Immigrants | West Indies | 0.0 /100 | #289 | Tragic 96.5% |
| British West Indians | 0.0 /100 | #290 | Tragic 96.5% |