Alaska Native vs South African 6th Grade
COMPARE
Alaska Native
South African
6th Grade
6th Grade Comparison
Alaska Natives
South Africans
98.0%
6TH GRADE
100.0/ 100
METRIC RATING
32nd/ 347
METRIC RANK
97.5%
6TH GRADE
98.2/ 100
METRIC RATING
101st/ 347
METRIC RANK
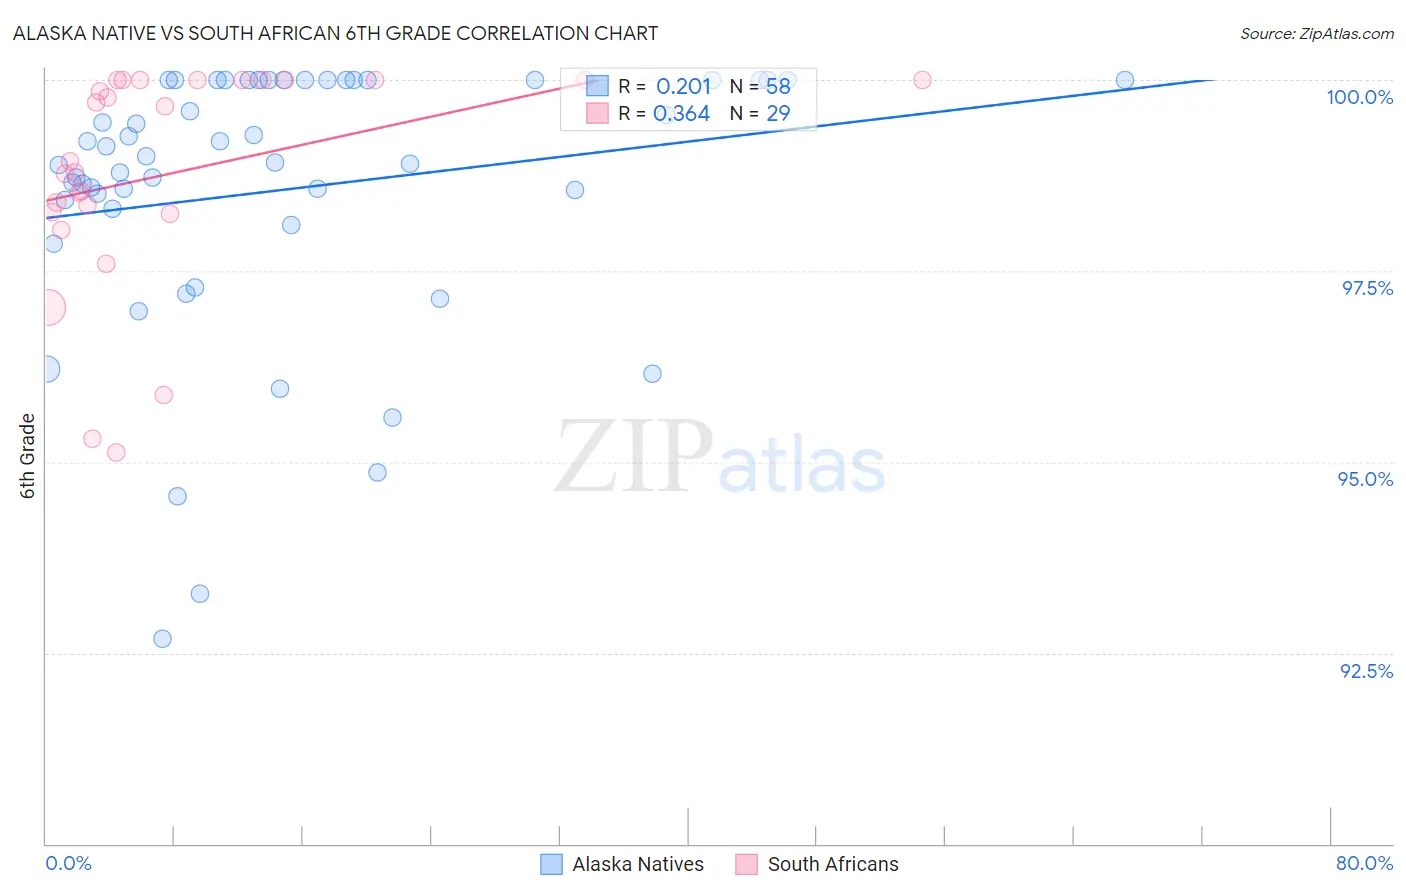
Alaska Native vs South African 6th Grade Correlation Chart
The statistical analysis conducted on geographies consisting of 76,778,057 people shows a weak positive correlation between the proportion of Alaska Natives and percentage of population with at least 6th grade education in the United States with a correlation coefficient (R) of 0.201 and weighted average of 98.0%. Similarly, the statistical analysis conducted on geographies consisting of 182,604,532 people shows a mild positive correlation between the proportion of South Africans and percentage of population with at least 6th grade education in the United States with a correlation coefficient (R) of 0.364 and weighted average of 97.5%, a difference of 0.50%.
6th Grade Correlation Summary
| Measurement | Alaska Native | South African |
| Minimum | 92.7% | 95.1% |
| Maximum | 100.0% | 100.0% |
| Range | 7.3% | 4.9% |
| Mean | 98.6% | 98.8% |
| Median | 99.0% | 98.9% |
| Interquartile 25% (IQ1) | 98.3% | 98.3% |
| Interquartile 75% (IQ3) | 100.0% | 100.0% |
| Interquartile Range (IQR) | 1.7% | 1.7% |
| Standard Deviation (Sample) | 1.7% | 1.4% |
| Standard Deviation (Population) | 1.7% | 1.4% |
Similar Demographics by 6th Grade
Demographics Similar to Alaska Natives by 6th Grade
In terms of 6th grade, the demographic groups most similar to Alaska Natives are French Canadian (98.0%, a difference of 0.010%), European (98.0%, a difference of 0.010%), Yup'ik (98.0%, a difference of 0.020%), Scandinavian (98.0%, a difference of 0.020%), and French (98.0%, a difference of 0.020%).
| Demographics | Rating | Rank | 6th Grade |
| Scotch-Irish | 100.0 /100 | #25 | Exceptional 98.0% |
| Czechs | 100.0 /100 | #26 | Exceptional 98.0% |
| Yup'ik | 100.0 /100 | #27 | Exceptional 98.0% |
| Scandinavians | 100.0 /100 | #28 | Exceptional 98.0% |
| French | 100.0 /100 | #29 | Exceptional 98.0% |
| French Canadians | 100.0 /100 | #30 | Exceptional 98.0% |
| Europeans | 100.0 /100 | #31 | Exceptional 98.0% |
| Alaska Natives | 100.0 /100 | #32 | Exceptional 98.0% |
| Chippewa | 100.0 /100 | #33 | Exceptional 97.9% |
| Swiss | 100.0 /100 | #34 | Exceptional 97.9% |
| Chinese | 100.0 /100 | #35 | Exceptional 97.9% |
| Italians | 100.0 /100 | #36 | Exceptional 97.9% |
| British | 100.0 /100 | #37 | Exceptional 97.9% |
| Belgians | 100.0 /100 | #38 | Exceptional 97.9% |
| Luxembourgers | 99.9 /100 | #39 | Exceptional 97.9% |
Demographics Similar to South Africans by 6th Grade
In terms of 6th grade, the demographic groups most similar to South Africans are Turkish (97.5%, a difference of 0.0%), Immigrants from Denmark (97.5%, a difference of 0.020%), Yugoslavian (97.5%, a difference of 0.020%), Choctaw (97.5%, a difference of 0.020%), and Bhutanese (97.5%, a difference of 0.020%).
| Demographics | Rating | Rank | 6th Grade |
| Cypriots | 98.7 /100 | #94 | Exceptional 97.5% |
| Immigrants | Ireland | 98.7 /100 | #95 | Exceptional 97.5% |
| Immigrants | Germany | 98.6 /100 | #96 | Exceptional 97.5% |
| Immigrants | Sweden | 98.6 /100 | #97 | Exceptional 97.5% |
| Immigrants | Denmark | 98.5 /100 | #98 | Exceptional 97.5% |
| Yugoslavians | 98.5 /100 | #99 | Exceptional 97.5% |
| Turks | 98.3 /100 | #100 | Exceptional 97.5% |
| South Africans | 98.2 /100 | #101 | Exceptional 97.5% |
| Choctaw | 98.0 /100 | #102 | Exceptional 97.5% |
| Bhutanese | 98.0 /100 | #103 | Exceptional 97.5% |
| German Russians | 97.9 /100 | #104 | Exceptional 97.5% |
| Cheyenne | 97.9 /100 | #105 | Exceptional 97.5% |
| Menominee | 97.7 /100 | #106 | Exceptional 97.5% |
| Immigrants | Singapore | 97.6 /100 | #107 | Exceptional 97.5% |
| Immigrants | Nonimmigrants | 97.3 /100 | #108 | Exceptional 97.4% |