Alaska Native vs Sierra Leonean 6th Grade
COMPARE
Alaska Native
Sierra Leonean
6th Grade
6th Grade Comparison
Alaska Natives
Sierra Leoneans
98.0%
6TH GRADE
100.0/ 100
METRIC RATING
32nd/ 347
METRIC RANK
96.8%
6TH GRADE
8.0/ 100
METRIC RATING
215th/ 347
METRIC RANK
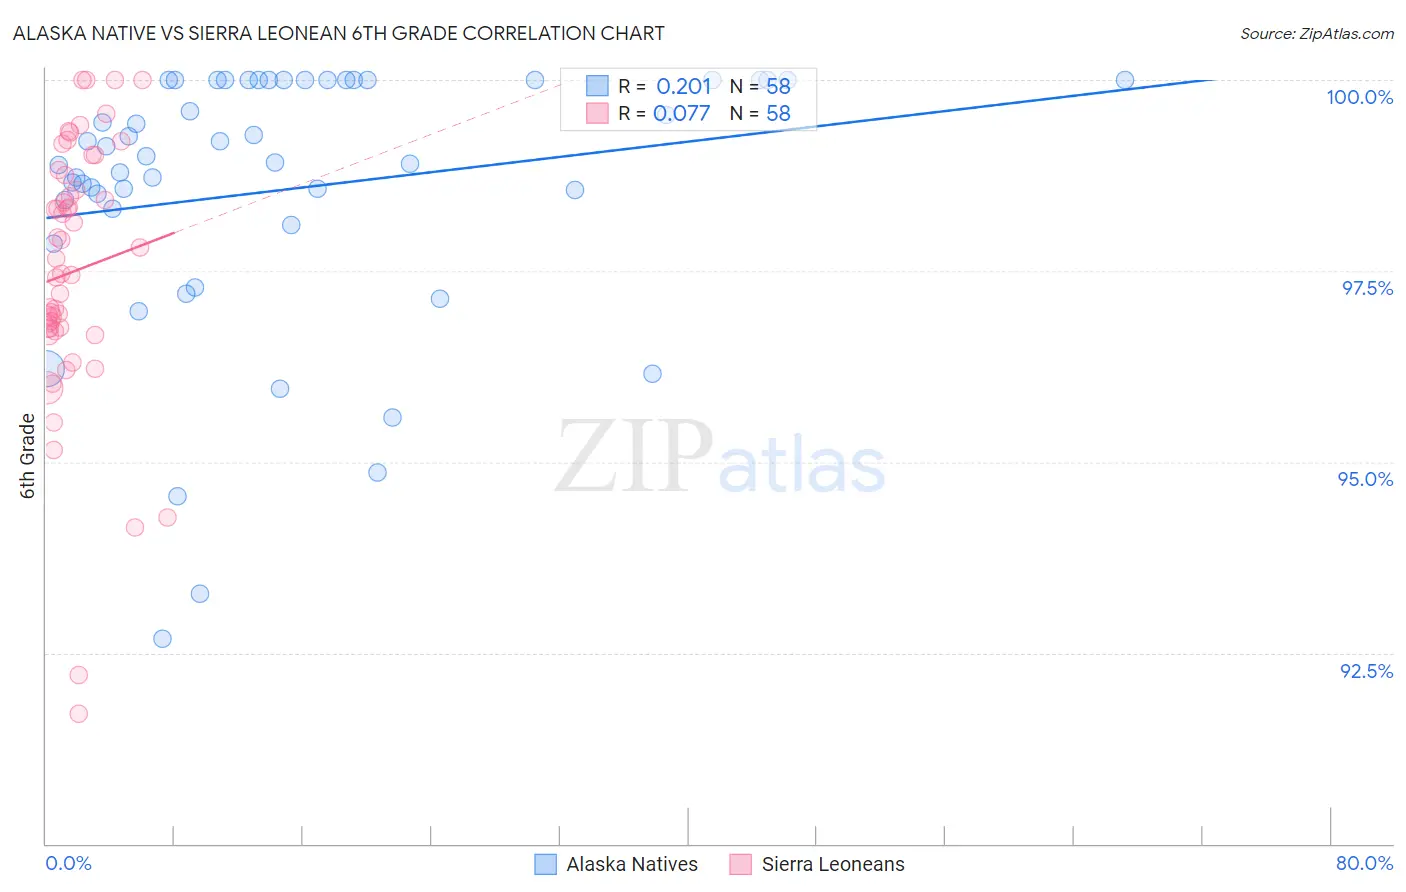
Alaska Native vs Sierra Leonean 6th Grade Correlation Chart
The statistical analysis conducted on geographies consisting of 76,778,057 people shows a weak positive correlation between the proportion of Alaska Natives and percentage of population with at least 6th grade education in the United States with a correlation coefficient (R) of 0.201 and weighted average of 98.0%. Similarly, the statistical analysis conducted on geographies consisting of 83,337,655 people shows a slight positive correlation between the proportion of Sierra Leoneans and percentage of population with at least 6th grade education in the United States with a correlation coefficient (R) of 0.077 and weighted average of 96.8%, a difference of 1.3%.
6th Grade Correlation Summary
| Measurement | Alaska Native | Sierra Leonean |
| Minimum | 92.7% | 91.7% |
| Maximum | 100.0% | 100.0% |
| Range | 7.3% | 8.3% |
| Mean | 98.6% | 97.5% |
| Median | 99.0% | 97.6% |
| Interquartile 25% (IQ1) | 98.3% | 96.7% |
| Interquartile 75% (IQ3) | 100.0% | 98.8% |
| Interquartile Range (IQR) | 1.7% | 2.0% |
| Standard Deviation (Sample) | 1.7% | 1.7% |
| Standard Deviation (Population) | 1.7% | 1.7% |
Similar Demographics by 6th Grade
Demographics Similar to Alaska Natives by 6th Grade
In terms of 6th grade, the demographic groups most similar to Alaska Natives are French Canadian (98.0%, a difference of 0.010%), European (98.0%, a difference of 0.010%), Yup'ik (98.0%, a difference of 0.020%), Scandinavian (98.0%, a difference of 0.020%), and French (98.0%, a difference of 0.020%).
| Demographics | Rating | Rank | 6th Grade |
| Scotch-Irish | 100.0 /100 | #25 | Exceptional 98.0% |
| Czechs | 100.0 /100 | #26 | Exceptional 98.0% |
| Yup'ik | 100.0 /100 | #27 | Exceptional 98.0% |
| Scandinavians | 100.0 /100 | #28 | Exceptional 98.0% |
| French | 100.0 /100 | #29 | Exceptional 98.0% |
| French Canadians | 100.0 /100 | #30 | Exceptional 98.0% |
| Europeans | 100.0 /100 | #31 | Exceptional 98.0% |
| Alaska Natives | 100.0 /100 | #32 | Exceptional 98.0% |
| Chippewa | 100.0 /100 | #33 | Exceptional 97.9% |
| Swiss | 100.0 /100 | #34 | Exceptional 97.9% |
| Chinese | 100.0 /100 | #35 | Exceptional 97.9% |
| Italians | 100.0 /100 | #36 | Exceptional 97.9% |
| British | 100.0 /100 | #37 | Exceptional 97.9% |
| Belgians | 100.0 /100 | #38 | Exceptional 97.9% |
| Luxembourgers | 99.9 /100 | #39 | Exceptional 97.9% |
Demographics Similar to Sierra Leoneans by 6th Grade
In terms of 6th grade, the demographic groups most similar to Sierra Leoneans are Portuguese (96.8%, a difference of 0.0%), Paiute (96.8%, a difference of 0.0%), Moroccan (96.8%, a difference of 0.010%), Immigrants from Sudan (96.8%, a difference of 0.010%), and Liberian (96.8%, a difference of 0.010%).
| Demographics | Rating | Rank | 6th Grade |
| Samoans | 11.0 /100 | #208 | Poor 96.8% |
| Immigrants | Oceania | 11.0 /100 | #209 | Poor 96.8% |
| Immigrants | Nepal | 10.1 /100 | #210 | Poor 96.8% |
| Immigrants | Iraq | 9.2 /100 | #211 | Tragic 96.8% |
| Moroccans | 9.0 /100 | #212 | Tragic 96.8% |
| Immigrants | Sudan | 8.7 /100 | #213 | Tragic 96.8% |
| Portuguese | 8.2 /100 | #214 | Tragic 96.8% |
| Sierra Leoneans | 8.0 /100 | #215 | Tragic 96.8% |
| Paiute | 7.8 /100 | #216 | Tragic 96.8% |
| Liberians | 7.5 /100 | #217 | Tragic 96.8% |
| Navajo | 7.3 /100 | #218 | Tragic 96.8% |
| Costa Ricans | 6.8 /100 | #219 | Tragic 96.8% |
| Immigrants | Morocco | 6.2 /100 | #220 | Tragic 96.7% |
| Tongans | 6.1 /100 | #221 | Tragic 96.7% |
| Immigrants | Syria | 5.9 /100 | #222 | Tragic 96.7% |