Latvian vs Creek 10th Grade
COMPARE
Latvian
Creek
10th Grade
10th Grade Comparison
Latvians
Creek
95.6%
10TH GRADE
100.0/ 100
METRIC RATING
17th/ 347
METRIC RANK
94.2%
10TH GRADE
91.9/ 100
METRIC RATING
133rd/ 347
METRIC RANK
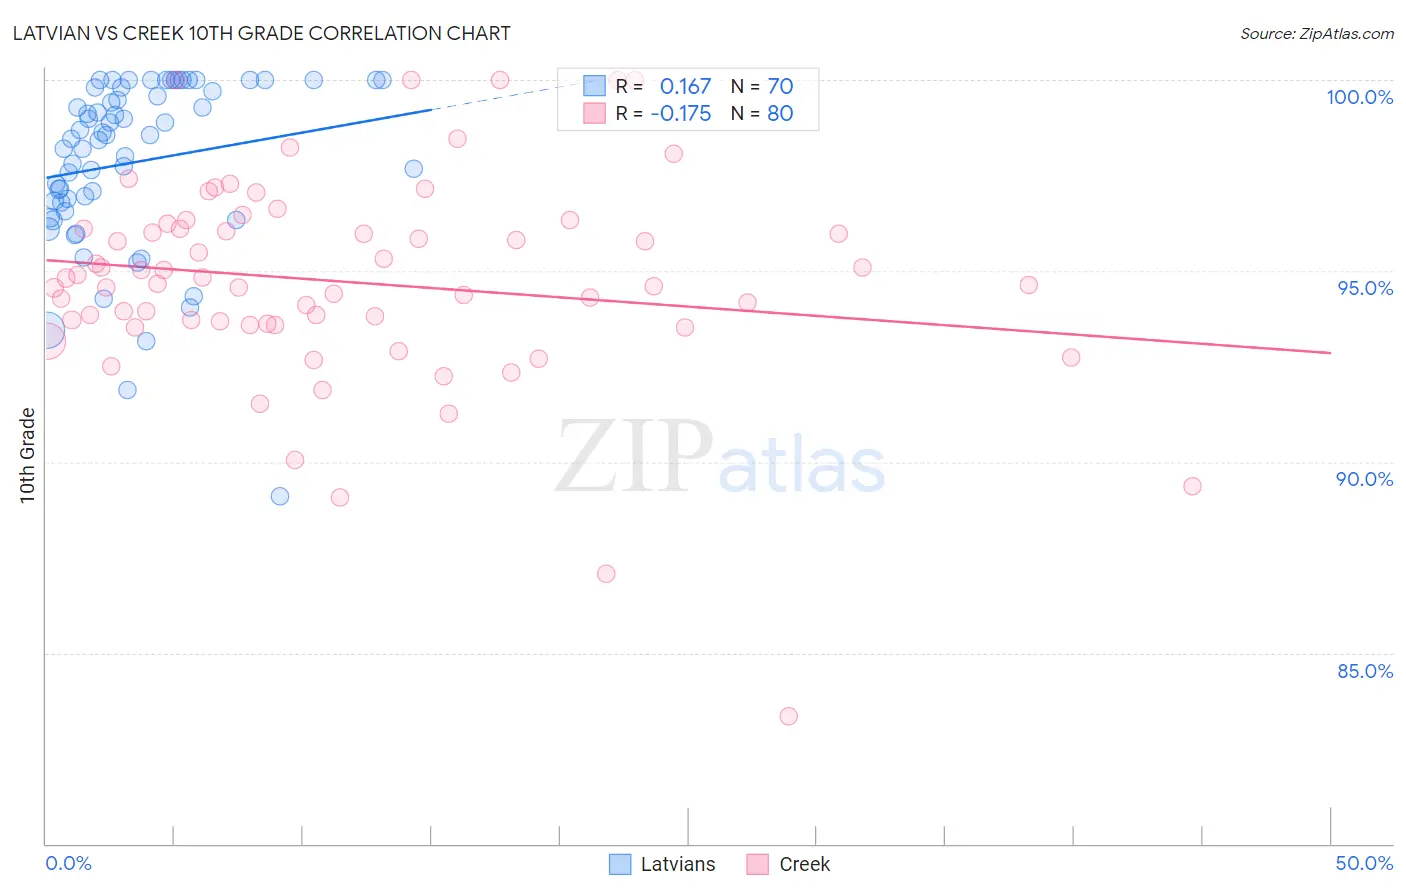
Latvian vs Creek 10th Grade Correlation Chart
The statistical analysis conducted on geographies consisting of 220,726,693 people shows a poor positive correlation between the proportion of Latvians and percentage of population with at least 10th grade education in the United States with a correlation coefficient (R) of 0.167 and weighted average of 95.6%. Similarly, the statistical analysis conducted on geographies consisting of 178,480,629 people shows a poor negative correlation between the proportion of Creek and percentage of population with at least 10th grade education in the United States with a correlation coefficient (R) of -0.175 and weighted average of 94.2%, a difference of 1.4%.
10th Grade Correlation Summary
| Measurement | Latvian | Creek |
| Minimum | 89.1% | 83.3% |
| Maximum | 100.0% | 100.0% |
| Range | 10.9% | 16.7% |
| Mean | 97.8% | 94.7% |
| Median | 98.5% | 94.6% |
| Interquartile 25% (IQ1) | 96.8% | 93.6% |
| Interquartile 75% (IQ3) | 99.8% | 96.1% |
| Interquartile Range (IQR) | 3.0% | 2.5% |
| Standard Deviation (Sample) | 2.2% | 2.7% |
| Standard Deviation (Population) | 2.2% | 2.7% |
Similar Demographics by 10th Grade
Demographics Similar to Latvians by 10th Grade
In terms of 10th grade, the demographic groups most similar to Latvians are Scottish (95.6%, a difference of 0.010%), Italian (95.6%, a difference of 0.010%), Scandinavian (95.6%, a difference of 0.010%), Irish (95.6%, a difference of 0.020%), and Chinese (95.5%, a difference of 0.030%).
| Demographics | Rating | Rank | 10th Grade |
| Croatians | 100.0 /100 | #10 | Exceptional 95.7% |
| Danes | 100.0 /100 | #11 | Exceptional 95.7% |
| Tlingit-Haida | 100.0 /100 | #12 | Exceptional 95.7% |
| English | 100.0 /100 | #13 | Exceptional 95.6% |
| Tsimshian | 100.0 /100 | #14 | Exceptional 95.6% |
| Irish | 100.0 /100 | #15 | Exceptional 95.6% |
| Scottish | 100.0 /100 | #16 | Exceptional 95.6% |
| Latvians | 100.0 /100 | #17 | Exceptional 95.6% |
| Italians | 100.0 /100 | #18 | Exceptional 95.6% |
| Scandinavians | 100.0 /100 | #19 | Exceptional 95.6% |
| Chinese | 100.0 /100 | #20 | Exceptional 95.5% |
| Dutch | 100.0 /100 | #21 | Exceptional 95.5% |
| Eastern Europeans | 100.0 /100 | #22 | Exceptional 95.5% |
| Czechs | 100.0 /100 | #23 | Exceptional 95.5% |
| Europeans | 100.0 /100 | #24 | Exceptional 95.5% |
Demographics Similar to Creek by 10th Grade
In terms of 10th grade, the demographic groups most similar to Creek are Immigrants from Russia (94.3%, a difference of 0.010%), Osage (94.2%, a difference of 0.010%), Immigrants from Eastern Europe (94.3%, a difference of 0.020%), Immigrants from Korea (94.2%, a difference of 0.020%), and Iroquois (94.3%, a difference of 0.030%).
| Demographics | Rating | Rank | 10th Grade |
| Immigrants | Iran | 94.4 /100 | #126 | Exceptional 94.3% |
| Israelis | 93.8 /100 | #127 | Exceptional 94.3% |
| Potawatomi | 93.6 /100 | #128 | Exceptional 94.3% |
| Iroquois | 92.8 /100 | #129 | Exceptional 94.3% |
| Immigrants | Greece | 92.7 /100 | #130 | Exceptional 94.3% |
| Immigrants | Eastern Europe | 92.5 /100 | #131 | Exceptional 94.3% |
| Immigrants | Russia | 92.4 /100 | #132 | Exceptional 94.3% |
| Creek | 91.9 /100 | #133 | Exceptional 94.2% |
| Osage | 91.7 /100 | #134 | Exceptional 94.2% |
| Immigrants | Korea | 91.3 /100 | #135 | Exceptional 94.2% |
| Shoshone | 90.8 /100 | #136 | Exceptional 94.2% |
| Arapaho | 90.5 /100 | #137 | Exceptional 94.2% |
| Immigrants | Sri Lanka | 89.9 /100 | #138 | Excellent 94.2% |
| Immigrants | Bosnia and Herzegovina | 89.4 /100 | #139 | Excellent 94.2% |
| Immigrants | Jordan | 87.6 /100 | #140 | Excellent 94.1% |