Alaska Native vs Creek Seniors Poverty Over the Age of 65
COMPARE
Alaska Native
Creek
Seniors Poverty Over the Age of 65
Seniors Poverty Over the Age of 65 Comparison
Alaska Natives
Creek
10.8%
SENIORS POVERTY OVER THE AGE OF 65
60.3/ 100
METRIC RATING
167th/ 347
METRIC RANK
10.9%
SENIORS POVERTY OVER THE AGE OF 65
49.6/ 100
METRIC RATING
175th/ 347
METRIC RANK
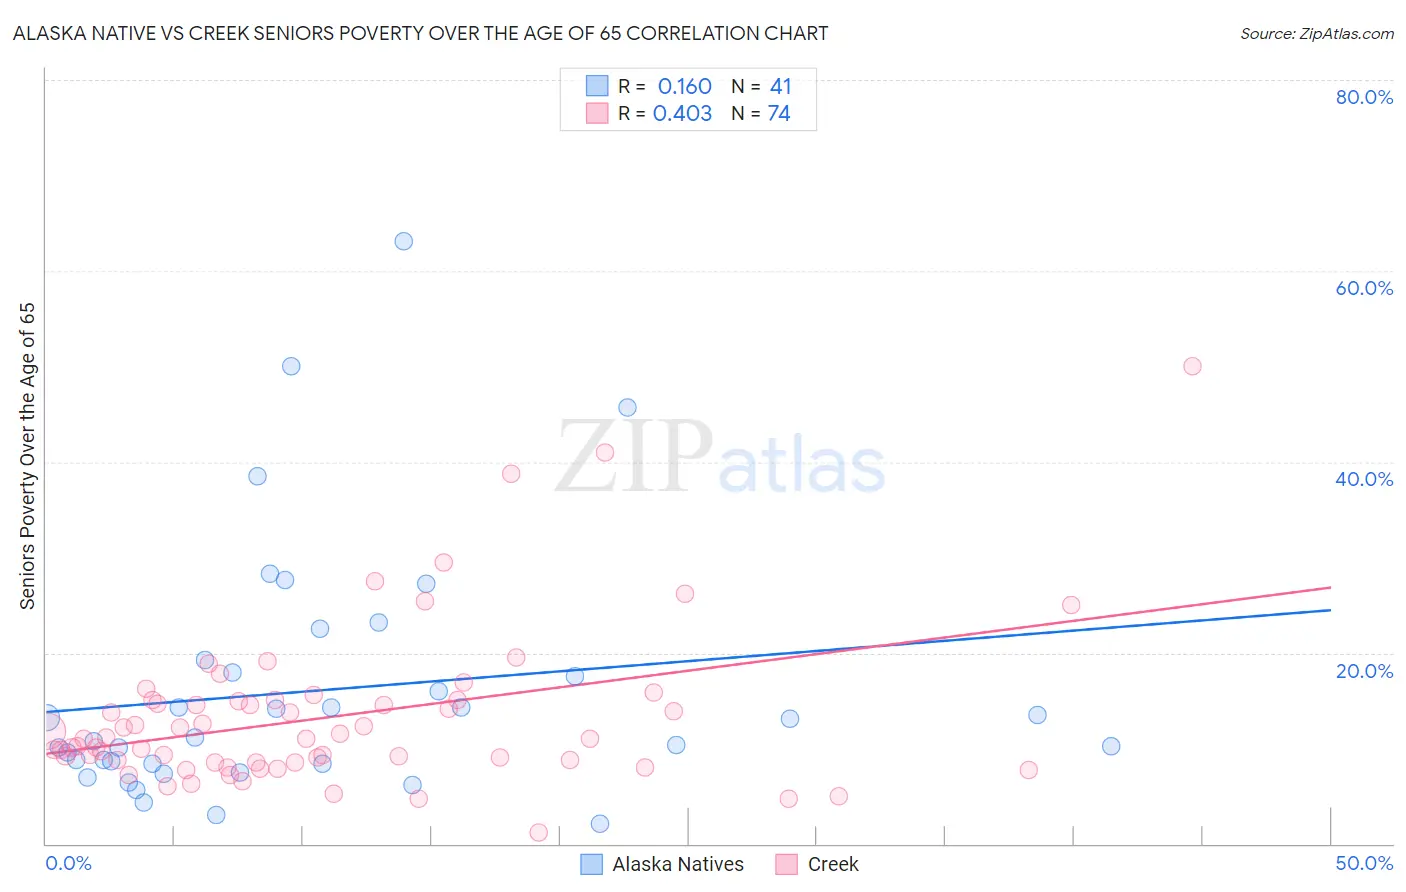
Alaska Native vs Creek Seniors Poverty Over the Age of 65 Correlation Chart
The statistical analysis conducted on geographies consisting of 76,614,353 people shows a poor positive correlation between the proportion of Alaska Natives and poverty level among seniors over the age of 65 in the United States with a correlation coefficient (R) of 0.160 and weighted average of 10.8%. Similarly, the statistical analysis conducted on geographies consisting of 178,107,079 people shows a moderate positive correlation between the proportion of Creek and poverty level among seniors over the age of 65 in the United States with a correlation coefficient (R) of 0.403 and weighted average of 10.9%, a difference of 0.97%.
Seniors Poverty Over the Age of 65 Correlation Summary
| Measurement | Alaska Native | Creek |
| Minimum | 2.0% | 1.2% |
| Maximum | 63.2% | 50.0% |
| Range | 61.1% | 48.8% |
| Mean | 16.1% | 13.3% |
| Median | 11.1% | 11.0% |
| Interquartile 25% (IQ1) | 8.4% | 8.6% |
| Interquartile 75% (IQ3) | 18.6% | 15.0% |
| Interquartile Range (IQR) | 10.2% | 6.4% |
| Standard Deviation (Sample) | 13.1% | 8.3% |
| Standard Deviation (Population) | 12.9% | 8.2% |
Demographics Similar to Alaska Natives and Creek by Seniors Poverty Over the Age of 65
In terms of seniors poverty over the age of 65, the demographic groups most similar to Alaska Natives are Malaysian (10.8%, a difference of 0.16%), Immigrants from South Eastern Asia (10.8%, a difference of 0.17%), Potawatomi (10.8%, a difference of 0.22%), Mongolian (10.9%, a difference of 0.22%), and Sri Lankan (10.9%, a difference of 0.32%). Similarly, the demographic groups most similar to Creek are Immigrants from Sudan (10.9%, a difference of 0.040%), Spaniard (10.9%, a difference of 0.10%), Immigrants from Malaysia (11.0%, a difference of 0.15%), Cherokee (11.0%, a difference of 0.20%), and German Russian (11.0%, a difference of 0.24%).
| Demographics | Rating | Rank | Seniors Poverty Over the Age of 65 |
| Arabs | 65.2 /100 | #161 | Good 10.8% |
| Immigrants | Indonesia | 64.8 /100 | #162 | Good 10.8% |
| Tsimshian | 64.5 /100 | #163 | Good 10.8% |
| Potawatomi | 62.6 /100 | #164 | Good 10.8% |
| Immigrants | South Eastern Asia | 62.1 /100 | #165 | Good 10.8% |
| Malaysians | 62.0 /100 | #166 | Good 10.8% |
| Alaska Natives | 60.3 /100 | #167 | Good 10.8% |
| Mongolians | 58.0 /100 | #168 | Average 10.9% |
| Sri Lankans | 56.8 /100 | #169 | Average 10.9% |
| Immigrants | Eastern Europe | 55.8 /100 | #170 | Average 10.9% |
| Immigrants | Nonimmigrants | 55.1 /100 | #171 | Average 10.9% |
| Immigrants | Syria | 54.7 /100 | #172 | Average 10.9% |
| Spaniards | 50.7 /100 | #173 | Average 10.9% |
| Immigrants | Sudan | 50.0 /100 | #174 | Average 10.9% |
| Creek | 49.6 /100 | #175 | Average 10.9% |
| Immigrants | Malaysia | 47.9 /100 | #176 | Average 11.0% |
| Cherokee | 47.3 /100 | #177 | Average 11.0% |
| German Russians | 46.9 /100 | #178 | Average 11.0% |
| Immigrants | Northern Africa | 44.6 /100 | #179 | Average 11.0% |
| Immigrants | Thailand | 43.5 /100 | #180 | Average 11.0% |
| Immigrants | Eastern Africa | 43.4 /100 | #181 | Average 11.0% |