Zimbabwean vs Immigrants from Canada Vision Disability
COMPARE
Zimbabwean
Immigrants from Canada
Vision Disability
Vision Disability Comparison
Zimbabweans
Immigrants from Canada
2.0%
VISION DISABILITY
99.7/ 100
METRIC RATING
39th/ 347
METRIC RANK
2.2%
VISION DISABILITY
50.0/ 100
METRIC RATING
174th/ 347
METRIC RANK
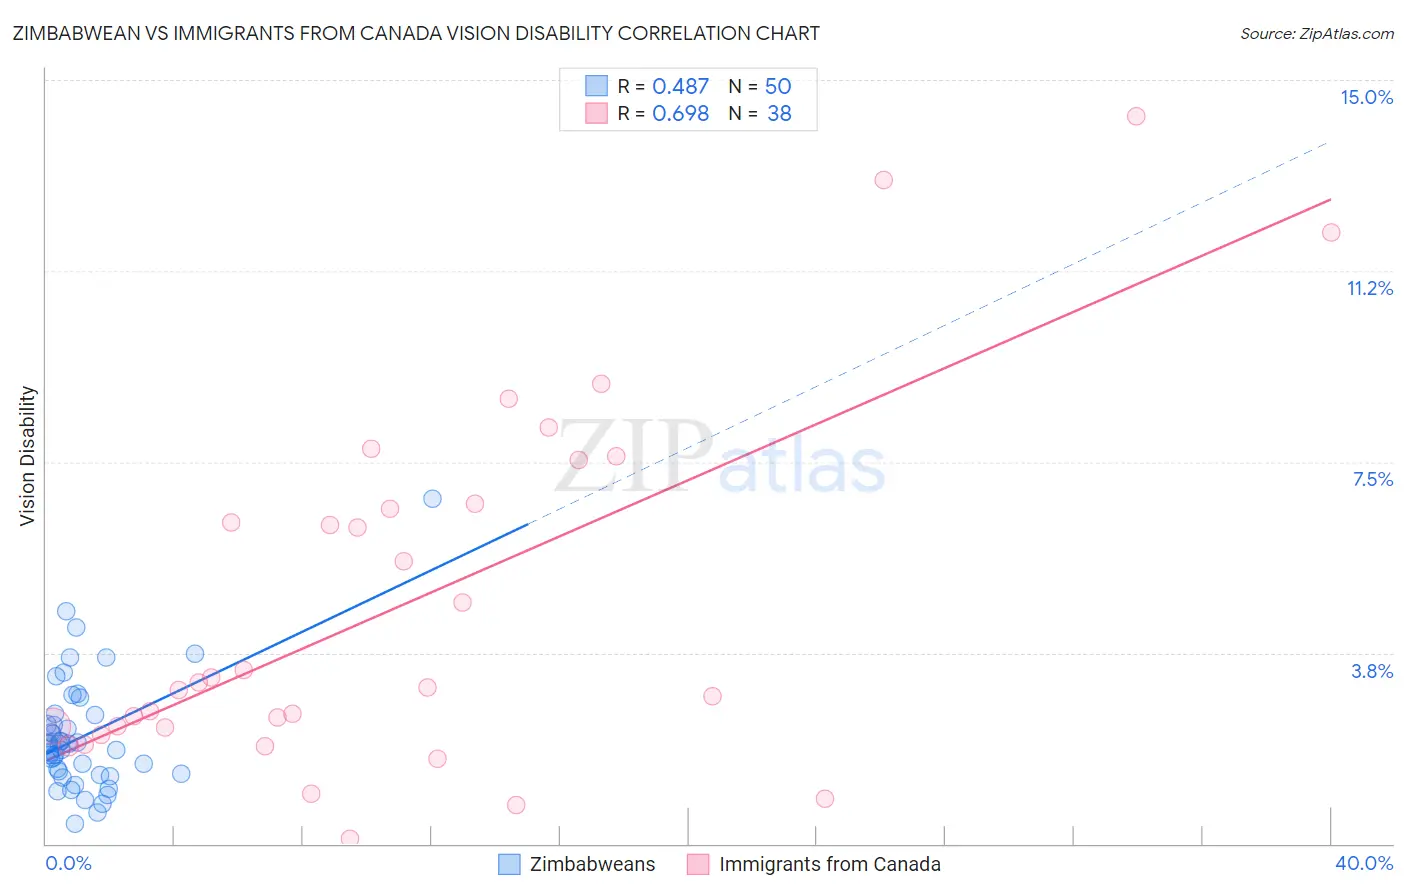
Zimbabwean vs Immigrants from Canada Vision Disability Correlation Chart
The statistical analysis conducted on geographies consisting of 69,201,681 people shows a moderate positive correlation between the proportion of Zimbabweans and percentage of population with vision disability in the United States with a correlation coefficient (R) of 0.487 and weighted average of 2.0%. Similarly, the statistical analysis conducted on geographies consisting of 458,814,509 people shows a significant positive correlation between the proportion of Immigrants from Canada and percentage of population with vision disability in the United States with a correlation coefficient (R) of 0.698 and weighted average of 2.2%, a difference of 10.4%.
Vision Disability Correlation Summary
| Measurement | Zimbabwean | Immigrants from Canada |
| Minimum | 0.38% | 0.10% |
| Maximum | 6.8% | 14.3% |
| Range | 6.4% | 14.2% |
| Mean | 2.1% | 4.7% |
| Median | 2.0% | 3.1% |
| Interquartile 25% (IQ1) | 1.4% | 2.3% |
| Interquartile 75% (IQ3) | 2.5% | 6.7% |
| Interquartile Range (IQR) | 1.2% | 4.4% |
| Standard Deviation (Sample) | 1.1% | 3.5% |
| Standard Deviation (Population) | 1.1% | 3.5% |
Similar Demographics by Vision Disability
Demographics Similar to Zimbabweans by Vision Disability
In terms of vision disability, the demographic groups most similar to Zimbabweans are Immigrants from Kuwait (2.0%, a difference of 0.060%), Bhutanese (2.0%, a difference of 0.090%), Immigrants from Ireland (2.0%, a difference of 0.20%), Cypriot (2.0%, a difference of 0.22%), and Cambodian (2.0%, a difference of 0.34%).
| Demographics | Rating | Rank | Vision Disability |
| Luxembourgers | 99.9 /100 | #32 | Exceptional 1.9% |
| Immigrants | Egypt | 99.9 /100 | #33 | Exceptional 1.9% |
| Immigrants | Turkey | 99.8 /100 | #34 | Exceptional 1.9% |
| Immigrants | Australia | 99.8 /100 | #35 | Exceptional 1.9% |
| Cambodians | 99.8 /100 | #36 | Exceptional 2.0% |
| Bhutanese | 99.8 /100 | #37 | Exceptional 2.0% |
| Immigrants | Kuwait | 99.8 /100 | #38 | Exceptional 2.0% |
| Zimbabweans | 99.7 /100 | #39 | Exceptional 2.0% |
| Immigrants | Ireland | 99.7 /100 | #40 | Exceptional 2.0% |
| Cypriots | 99.7 /100 | #41 | Exceptional 2.0% |
| Immigrants | Ethiopia | 99.7 /100 | #42 | Exceptional 2.0% |
| Eastern Europeans | 99.7 /100 | #43 | Exceptional 2.0% |
| Immigrants | Indonesia | 99.7 /100 | #44 | Exceptional 2.0% |
| Ethiopians | 99.7 /100 | #45 | Exceptional 2.0% |
| Immigrants | Sweden | 99.7 /100 | #46 | Exceptional 2.0% |
Demographics Similar to Immigrants from Canada by Vision Disability
In terms of vision disability, the demographic groups most similar to Immigrants from Canada are Scandinavian (2.2%, a difference of 0.0%), Northern European (2.2%, a difference of 0.010%), Immigrants from Fiji (2.2%, a difference of 0.15%), Yugoslavian (2.2%, a difference of 0.22%), and Slavic (2.2%, a difference of 0.26%).
| Demographics | Rating | Rank | Vision Disability |
| Immigrants | Africa | 62.6 /100 | #167 | Good 2.1% |
| Brazilians | 62.2 /100 | #168 | Good 2.1% |
| South American Indians | 57.4 /100 | #169 | Average 2.2% |
| Swiss | 55.7 /100 | #170 | Average 2.2% |
| Lebanese | 54.3 /100 | #171 | Average 2.2% |
| Northern Europeans | 50.1 /100 | #172 | Average 2.2% |
| Scandinavians | 50.0 /100 | #173 | Average 2.2% |
| Immigrants | Canada | 50.0 /100 | #174 | Average 2.2% |
| Immigrants | Fiji | 47.6 /100 | #175 | Average 2.2% |
| Yugoslavians | 46.5 /100 | #176 | Average 2.2% |
| Slavs | 46.0 /100 | #177 | Average 2.2% |
| Immigrants | Oceania | 45.1 /100 | #178 | Average 2.2% |
| Immigrants | North America | 44.5 /100 | #179 | Average 2.2% |
| Uruguayans | 42.7 /100 | #180 | Average 2.2% |
| Immigrants | Western Europe | 41.1 /100 | #181 | Average 2.2% |