Zimbabwean vs Immigrants from Fiji Disability Age 18 to 34
COMPARE
Zimbabwean
Immigrants from Fiji
Disability Age 18 to 34
Disability Age 18 to 34 Comparison
Zimbabweans
Immigrants from Fiji
6.5%
DISABILITY AGE 18 TO 34
74.7/ 100
METRIC RATING
158th/ 347
METRIC RANK
6.4%
DISABILITY AGE 18 TO 34
87.3/ 100
METRIC RATING
140th/ 347
METRIC RANK
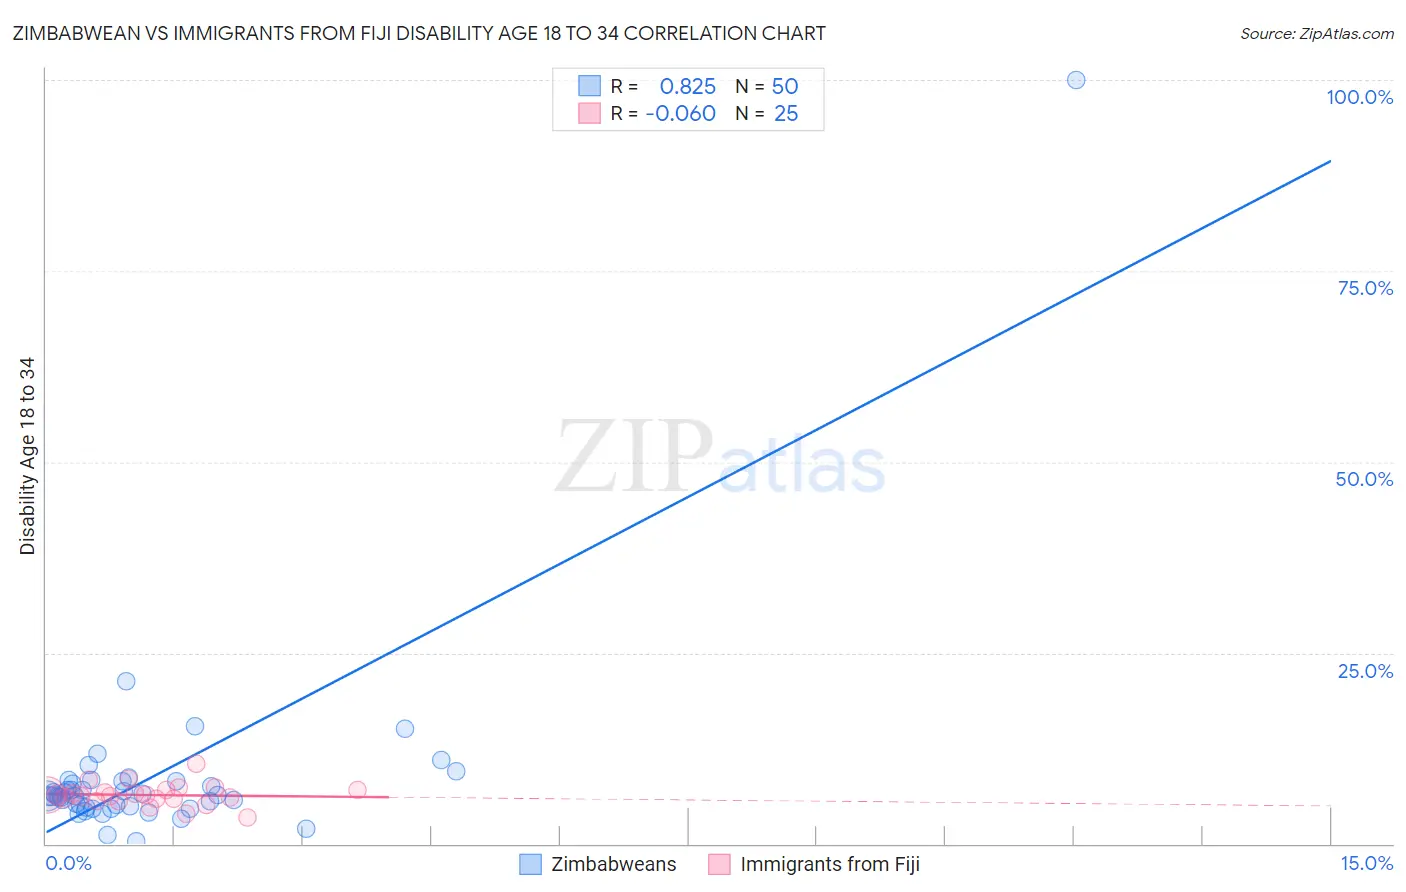
Zimbabwean vs Immigrants from Fiji Disability Age 18 to 34 Correlation Chart
The statistical analysis conducted on geographies consisting of 69,205,291 people shows a very strong positive correlation between the proportion of Zimbabweans and percentage of population with a disability between the ages 18 and 35 in the United States with a correlation coefficient (R) of 0.825 and weighted average of 6.5%. Similarly, the statistical analysis conducted on geographies consisting of 93,735,426 people shows a slight negative correlation between the proportion of Immigrants from Fiji and percentage of population with a disability between the ages 18 and 35 in the United States with a correlation coefficient (R) of -0.060 and weighted average of 6.4%, a difference of 1.5%.
Disability Age 18 to 34 Correlation Summary
| Measurement | Zimbabwean | Immigrants from Fiji |
| Minimum | 0.28% | 3.5% |
| Maximum | 100.0% | 10.5% |
| Range | 99.7% | 7.0% |
| Mean | 8.7% | 6.4% |
| Median | 6.3% | 6.3% |
| Interquartile 25% (IQ1) | 5.0% | 5.7% |
| Interquartile 75% (IQ3) | 8.1% | 7.0% |
| Interquartile Range (IQR) | 3.1% | 1.3% |
| Standard Deviation (Sample) | 13.6% | 1.4% |
| Standard Deviation (Population) | 13.5% | 1.4% |
Demographics Similar to Zimbabweans and Immigrants from Fiji by Disability Age 18 to 34
In terms of disability age 18 to 34, the demographic groups most similar to Zimbabweans are Immigrants from Sierra Leone (6.5%, a difference of 0.030%), Immigrants from Panama (6.5%, a difference of 0.060%), Dominican (6.5%, a difference of 0.11%), Inupiat (6.5%, a difference of 0.19%), and Immigrants from Central America (6.5%, a difference of 0.20%). Similarly, the demographic groups most similar to Immigrants from Fiji are Immigrants from Belize (6.4%, a difference of 0.020%), Jamaican (6.4%, a difference of 0.090%), South American Indian (6.4%, a difference of 0.12%), Immigrants from Latvia (6.4%, a difference of 0.14%), and Albanian (6.4%, a difference of 0.31%).
| Demographics | Rating | Rank | Disability Age 18 to 34 |
| Immigrants | Belize | 87.4 /100 | #139 | Excellent 6.4% |
| Immigrants | Fiji | 87.3 /100 | #140 | Excellent 6.4% |
| Jamaicans | 86.8 /100 | #141 | Excellent 6.4% |
| South American Indians | 86.5 /100 | #142 | Excellent 6.4% |
| Immigrants | Latvia | 86.4 /100 | #143 | Excellent 6.4% |
| Albanians | 85.3 /100 | #144 | Excellent 6.4% |
| Moroccans | 85.2 /100 | #145 | Excellent 6.4% |
| Belizeans | 84.9 /100 | #146 | Excellent 6.4% |
| Immigrants | South Africa | 83.7 /100 | #147 | Excellent 6.4% |
| Immigrants | Belgium | 83.5 /100 | #148 | Excellent 6.4% |
| Hondurans | 83.1 /100 | #149 | Excellent 6.4% |
| Immigrants | Dominican Republic | 82.7 /100 | #150 | Excellent 6.4% |
| Tongans | 81.9 /100 | #151 | Excellent 6.4% |
| Bulgarians | 78.3 /100 | #152 | Good 6.5% |
| Immigrants | Eritrea | 77.4 /100 | #153 | Good 6.5% |
| Immigrants | Central America | 76.8 /100 | #154 | Good 6.5% |
| Inupiat | 76.7 /100 | #155 | Good 6.5% |
| Immigrants | Panama | 75.3 /100 | #156 | Good 6.5% |
| Immigrants | Sierra Leone | 75.0 /100 | #157 | Good 6.5% |
| Zimbabweans | 74.7 /100 | #158 | Good 6.5% |
| Dominicans | 73.6 /100 | #159 | Good 6.5% |