Romanian vs Immigrants from Canada Vision Disability
COMPARE
Romanian
Immigrants from Canada
Vision Disability
Vision Disability Comparison
Romanians
Immigrants from Canada
2.1%
VISION DISABILITY
95.7/ 100
METRIC RATING
96th/ 347
METRIC RANK
2.2%
VISION DISABILITY
50.0/ 100
METRIC RATING
174th/ 347
METRIC RANK
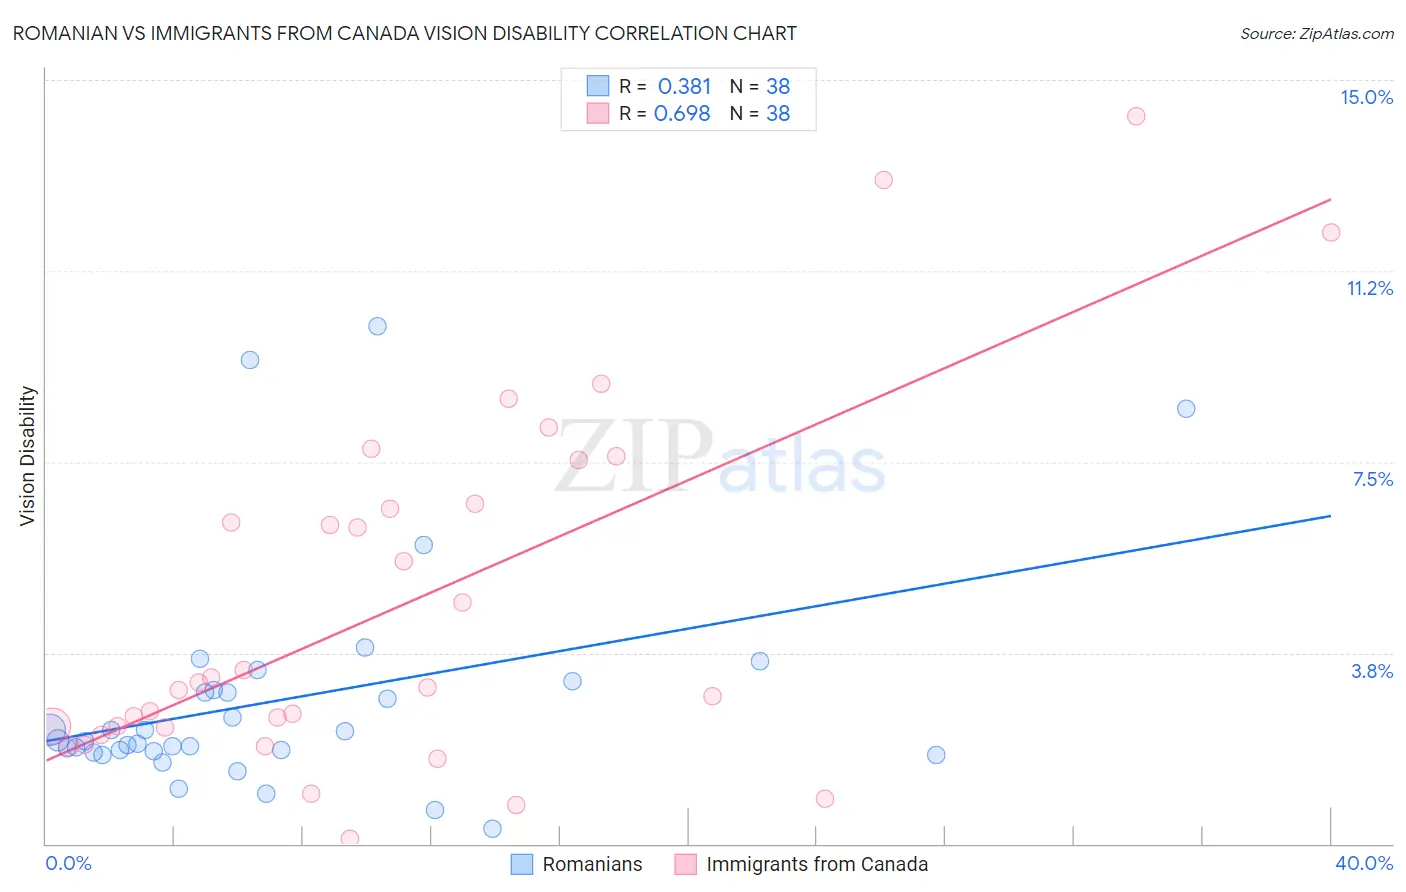
Romanian vs Immigrants from Canada Vision Disability Correlation Chart
The statistical analysis conducted on geographies consisting of 377,620,863 people shows a mild positive correlation between the proportion of Romanians and percentage of population with vision disability in the United States with a correlation coefficient (R) of 0.381 and weighted average of 2.1%. Similarly, the statistical analysis conducted on geographies consisting of 458,814,509 people shows a significant positive correlation between the proportion of Immigrants from Canada and percentage of population with vision disability in the United States with a correlation coefficient (R) of 0.698 and weighted average of 2.2%, a difference of 5.1%.
Vision Disability Correlation Summary
| Measurement | Romanian | Immigrants from Canada |
| Minimum | 0.28% | 0.10% |
| Maximum | 10.2% | 14.3% |
| Range | 9.9% | 14.2% |
| Mean | 2.8% | 4.7% |
| Median | 2.0% | 3.1% |
| Interquartile 25% (IQ1) | 1.8% | 2.3% |
| Interquartile 75% (IQ3) | 3.0% | 6.7% |
| Interquartile Range (IQR) | 1.2% | 4.4% |
| Standard Deviation (Sample) | 2.2% | 3.5% |
| Standard Deviation (Population) | 2.2% | 3.5% |
Similar Demographics by Vision Disability
Demographics Similar to Romanians by Vision Disability
In terms of vision disability, the demographic groups most similar to Romanians are Australian (2.1%, a difference of 0.060%), Immigrants from Afghanistan (2.1%, a difference of 0.070%), Immigrants from South Africa (2.1%, a difference of 0.11%), Immigrants from Croatia (2.1%, a difference of 0.13%), and Immigrants from Europe (2.1%, a difference of 0.15%).
| Demographics | Rating | Rank | Vision Disability |
| Immigrants | Eastern Africa | 97.0 /100 | #89 | Exceptional 2.0% |
| Immigrants | Lebanon | 96.7 /100 | #90 | Exceptional 2.1% |
| Immigrants | Somalia | 96.2 /100 | #91 | Exceptional 2.1% |
| Immigrants | Syria | 96.2 /100 | #92 | Exceptional 2.1% |
| Immigrants | Europe | 96.1 /100 | #93 | Exceptional 2.1% |
| Immigrants | Croatia | 96.0 /100 | #94 | Exceptional 2.1% |
| Australians | 95.9 /100 | #95 | Exceptional 2.1% |
| Romanians | 95.7 /100 | #96 | Exceptional 2.1% |
| Immigrants | Afghanistan | 95.6 /100 | #97 | Exceptional 2.1% |
| Immigrants | South Africa | 95.4 /100 | #98 | Exceptional 2.1% |
| Estonians | 95.3 /100 | #99 | Exceptional 2.1% |
| Greeks | 95.1 /100 | #100 | Exceptional 2.1% |
| Albanians | 94.9 /100 | #101 | Exceptional 2.1% |
| Sri Lankans | 94.8 /100 | #102 | Exceptional 2.1% |
| Immigrants | Austria | 94.4 /100 | #103 | Exceptional 2.1% |
Demographics Similar to Immigrants from Canada by Vision Disability
In terms of vision disability, the demographic groups most similar to Immigrants from Canada are Scandinavian (2.2%, a difference of 0.0%), Northern European (2.2%, a difference of 0.010%), Immigrants from Fiji (2.2%, a difference of 0.15%), Yugoslavian (2.2%, a difference of 0.22%), and Slavic (2.2%, a difference of 0.26%).
| Demographics | Rating | Rank | Vision Disability |
| Immigrants | Africa | 62.6 /100 | #167 | Good 2.1% |
| Brazilians | 62.2 /100 | #168 | Good 2.1% |
| South American Indians | 57.4 /100 | #169 | Average 2.2% |
| Swiss | 55.7 /100 | #170 | Average 2.2% |
| Lebanese | 54.3 /100 | #171 | Average 2.2% |
| Northern Europeans | 50.1 /100 | #172 | Average 2.2% |
| Scandinavians | 50.0 /100 | #173 | Average 2.2% |
| Immigrants | Canada | 50.0 /100 | #174 | Average 2.2% |
| Immigrants | Fiji | 47.6 /100 | #175 | Average 2.2% |
| Yugoslavians | 46.5 /100 | #176 | Average 2.2% |
| Slavs | 46.0 /100 | #177 | Average 2.2% |
| Immigrants | Oceania | 45.1 /100 | #178 | Average 2.2% |
| Immigrants | North America | 44.5 /100 | #179 | Average 2.2% |
| Uruguayans | 42.7 /100 | #180 | Average 2.2% |
| Immigrants | Western Europe | 41.1 /100 | #181 | Average 2.2% |