Nicaraguan vs Immigrants from Canada Vision Disability
COMPARE
Nicaraguan
Immigrants from Canada
Vision Disability
Vision Disability Comparison
Nicaraguans
Immigrants from Canada
2.3%
VISION DISABILITY
2.2/ 100
METRIC RATING
230th/ 347
METRIC RANK
2.2%
VISION DISABILITY
50.0/ 100
METRIC RATING
174th/ 347
METRIC RANK
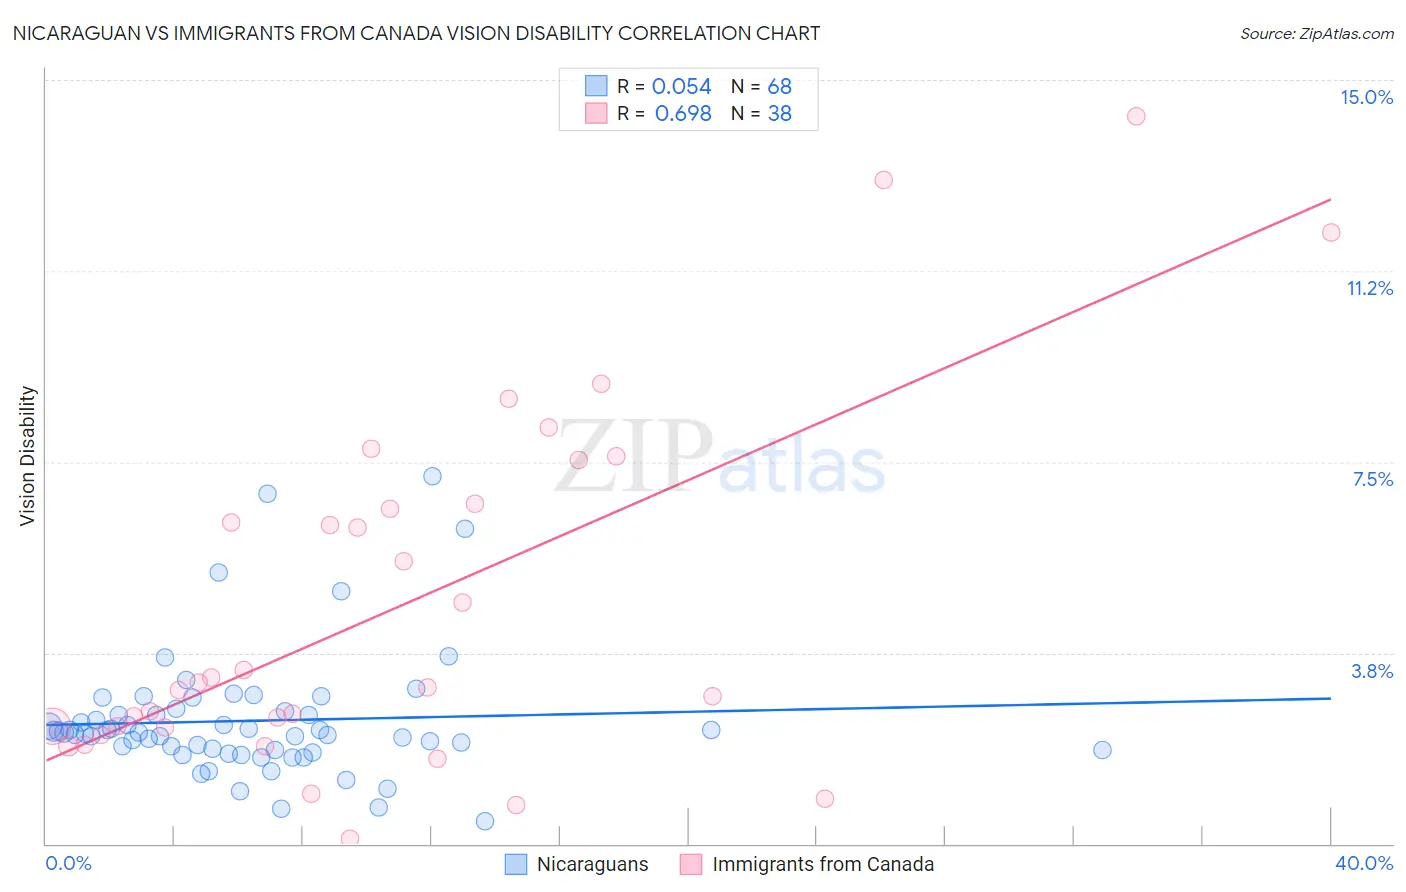
Nicaraguan vs Immigrants from Canada Vision Disability Correlation Chart
The statistical analysis conducted on geographies consisting of 285,594,144 people shows a slight positive correlation between the proportion of Nicaraguans and percentage of population with vision disability in the United States with a correlation coefficient (R) of 0.054 and weighted average of 2.3%. Similarly, the statistical analysis conducted on geographies consisting of 458,814,509 people shows a significant positive correlation between the proportion of Immigrants from Canada and percentage of population with vision disability in the United States with a correlation coefficient (R) of 0.698 and weighted average of 2.2%, a difference of 5.9%.
Vision Disability Correlation Summary
| Measurement | Nicaraguan | Immigrants from Canada |
| Minimum | 0.44% | 0.10% |
| Maximum | 7.2% | 14.3% |
| Range | 6.8% | 14.2% |
| Mean | 2.4% | 4.7% |
| Median | 2.2% | 3.1% |
| Interquartile 25% (IQ1) | 1.8% | 2.3% |
| Interquartile 75% (IQ3) | 2.6% | 6.7% |
| Interquartile Range (IQR) | 0.73% | 4.4% |
| Standard Deviation (Sample) | 1.2% | 3.5% |
| Standard Deviation (Population) | 1.2% | 3.5% |
Similar Demographics by Vision Disability
Demographics Similar to Nicaraguans by Vision Disability
In terms of vision disability, the demographic groups most similar to Nicaraguans are Welsh (2.3%, a difference of 0.070%), Hmong (2.3%, a difference of 0.15%), Immigrants from Ecuador (2.3%, a difference of 0.16%), German Russian (2.3%, a difference of 0.35%), and Central American (2.3%, a difference of 0.36%).
| Demographics | Rating | Rank | Vision Disability |
| Basques | 3.5 /100 | #223 | Tragic 2.3% |
| Irish | 3.4 /100 | #224 | Tragic 2.3% |
| Immigrants | Western Africa | 3.4 /100 | #225 | Tragic 2.3% |
| Immigrants | Germany | 3.0 /100 | #226 | Tragic 2.3% |
| Hawaiians | 2.9 /100 | #227 | Tragic 2.3% |
| Hmong | 2.5 /100 | #228 | Tragic 2.3% |
| Welsh | 2.3 /100 | #229 | Tragic 2.3% |
| Nicaraguans | 2.2 /100 | #230 | Tragic 2.3% |
| Immigrants | Ecuador | 2.0 /100 | #231 | Tragic 2.3% |
| German Russians | 1.8 /100 | #232 | Tragic 2.3% |
| Central Americans | 1.8 /100 | #233 | Tragic 2.3% |
| Scottish | 1.6 /100 | #234 | Tragic 2.3% |
| Marshallese | 1.5 /100 | #235 | Tragic 2.3% |
| Immigrants | Congo | 1.4 /100 | #236 | Tragic 2.3% |
| Immigrants | Portugal | 1.4 /100 | #237 | Tragic 2.3% |
Demographics Similar to Immigrants from Canada by Vision Disability
In terms of vision disability, the demographic groups most similar to Immigrants from Canada are Scandinavian (2.2%, a difference of 0.0%), Northern European (2.2%, a difference of 0.010%), Immigrants from Fiji (2.2%, a difference of 0.15%), Yugoslavian (2.2%, a difference of 0.22%), and Slavic (2.2%, a difference of 0.26%).
| Demographics | Rating | Rank | Vision Disability |
| Immigrants | Africa | 62.6 /100 | #167 | Good 2.1% |
| Brazilians | 62.2 /100 | #168 | Good 2.1% |
| South American Indians | 57.4 /100 | #169 | Average 2.2% |
| Swiss | 55.7 /100 | #170 | Average 2.2% |
| Lebanese | 54.3 /100 | #171 | Average 2.2% |
| Northern Europeans | 50.1 /100 | #172 | Average 2.2% |
| Scandinavians | 50.0 /100 | #173 | Average 2.2% |
| Immigrants | Canada | 50.0 /100 | #174 | Average 2.2% |
| Immigrants | Fiji | 47.6 /100 | #175 | Average 2.2% |
| Yugoslavians | 46.5 /100 | #176 | Average 2.2% |
| Slavs | 46.0 /100 | #177 | Average 2.2% |
| Immigrants | Oceania | 45.1 /100 | #178 | Average 2.2% |
| Immigrants | North America | 44.5 /100 | #179 | Average 2.2% |
| Uruguayans | 42.7 /100 | #180 | Average 2.2% |
| Immigrants | Western Europe | 41.1 /100 | #181 | Average 2.2% |