Yup'ik vs Immigrants from Belarus Family Households with Children
COMPARE
Yup'ik
Immigrants from Belarus
Family Households with Children
Family Households with Children Comparison
Yup'ik
Immigrants from Belarus
37.0%
FAMILY HOUSEHOLDS WITH CHILDREN
100/ 100
METRIC RATING
1st/ 347
METRIC RANK
26.8%
FAMILY HOUSEHOLDS WITH CHILDREN
1.1/ 100
METRIC RATING
261st/ 347
METRIC RANK
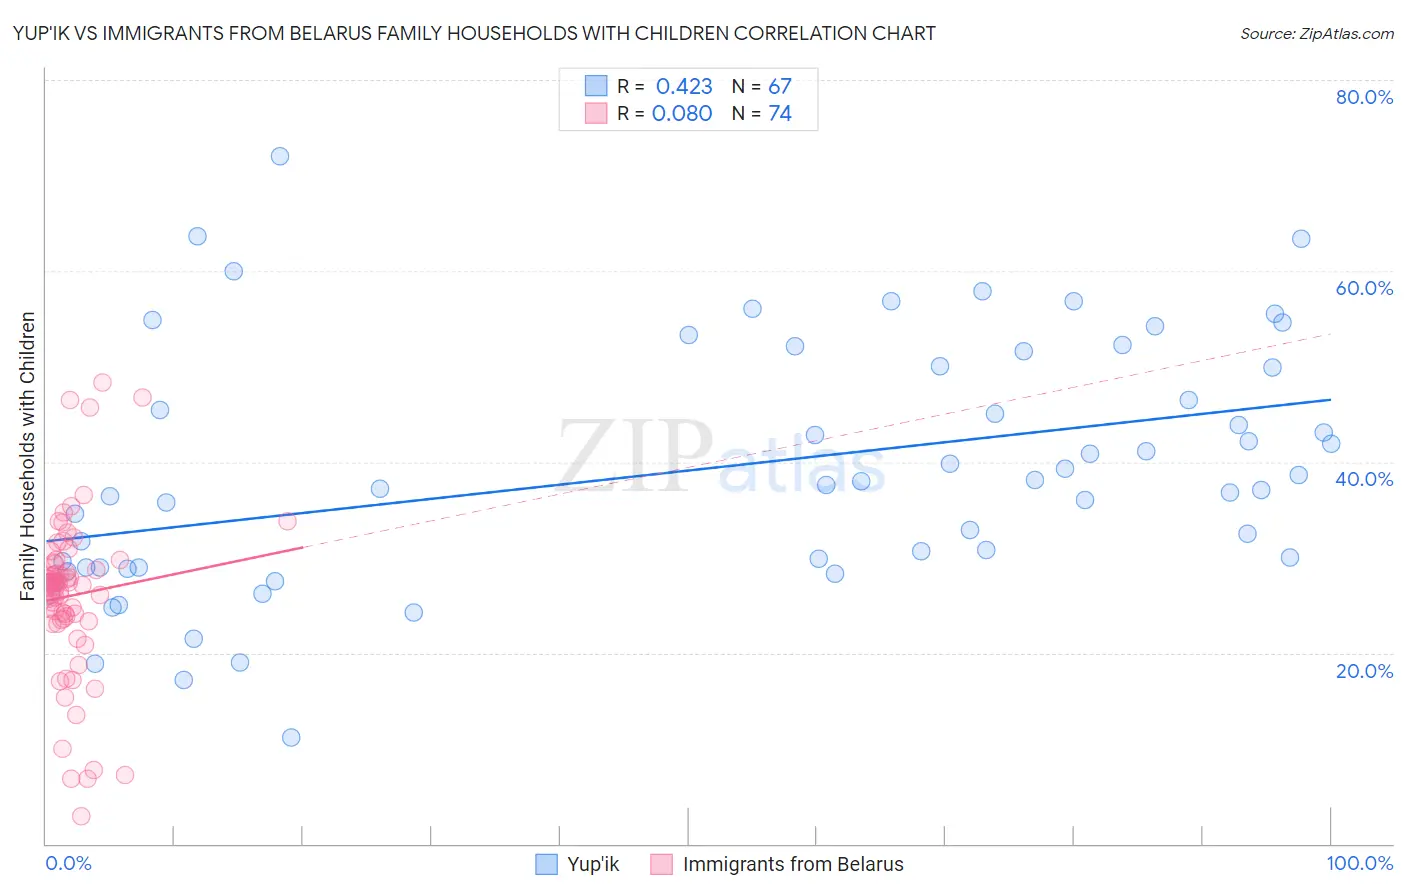
Yup'ik vs Immigrants from Belarus Family Households with Children Correlation Chart
The statistical analysis conducted on geographies consisting of 39,956,617 people shows a moderate positive correlation between the proportion of Yup'ik and percentage of family households with children in the United States with a correlation coefficient (R) of 0.423 and weighted average of 37.0%. Similarly, the statistical analysis conducted on geographies consisting of 150,186,430 people shows a slight positive correlation between the proportion of Immigrants from Belarus and percentage of family households with children in the United States with a correlation coefficient (R) of 0.080 and weighted average of 26.8%, a difference of 38.3%.
Family Households with Children Correlation Summary
| Measurement | Yup'ik | Immigrants from Belarus |
| Minimum | 11.1% | 2.8% |
| Maximum | 72.0% | 48.3% |
| Range | 60.9% | 45.4% |
| Mean | 39.1% | 26.0% |
| Median | 37.6% | 27.2% |
| Interquartile 25% (IQ1) | 28.9% | 23.5% |
| Interquartile 75% (IQ3) | 50.0% | 29.5% |
| Interquartile Range (IQR) | 21.1% | 6.0% |
| Standard Deviation (Sample) | 12.9% | 8.6% |
| Standard Deviation (Population) | 12.8% | 8.6% |
Similar Demographics by Family Households with Children
Demographics Similar to Yup'ik by Family Households with Children
In terms of family households with children, the demographic groups most similar to Yup'ik are Inupiat (32.8%, a difference of 12.7%), Immigrants from Mexico (31.6%, a difference of 17.1%), Mexican (31.4%, a difference of 18.0%), Tongan (31.2%, a difference of 18.5%), and Immigrants from India (31.0%, a difference of 19.2%).
| Demographics | Rating | Rank | Family Households with Children |
| Yup'ik | 100 /100 | #1 | Exceptional 37.0% |
| Inupiat | 100 /100 | #2 | Exceptional 32.8% |
| Immigrants | Mexico | 100.0 /100 | #3 | Exceptional 31.6% |
| Mexicans | 100.0 /100 | #4 | Exceptional 31.4% |
| Tongans | 100.0 /100 | #5 | Exceptional 31.2% |
| Immigrants | India | 100.0 /100 | #6 | Exceptional 31.0% |
| Immigrants | Central America | 100.0 /100 | #7 | Exceptional 31.0% |
| Yakama | 100.0 /100 | #8 | Exceptional 30.8% |
| Thais | 100.0 /100 | #9 | Exceptional 30.6% |
| Immigrants | Fiji | 100.0 /100 | #10 | Exceptional 30.5% |
| Nepalese | 100.0 /100 | #11 | Exceptional 30.5% |
| Immigrants | Pakistan | 100.0 /100 | #12 | Exceptional 30.2% |
| Afghans | 100.0 /100 | #13 | Exceptional 30.2% |
| Bangladeshis | 100.0 /100 | #14 | Exceptional 30.1% |
| Immigrants | South Central Asia | 100.0 /100 | #15 | Exceptional 30.0% |
Demographics Similar to Immigrants from Belarus by Family Households with Children
In terms of family households with children, the demographic groups most similar to Immigrants from Belarus are Immigrants from Jamaica (26.8%, a difference of 0.060%), Immigrants from Russia (26.8%, a difference of 0.060%), Immigrants from North Macedonia (26.7%, a difference of 0.060%), Immigrants from Lithuania (26.8%, a difference of 0.070%), and Taiwanese (26.7%, a difference of 0.090%).
| Demographics | Rating | Rank | Family Households with Children |
| Immigrants | Scotland | 1.5 /100 | #254 | Tragic 26.8% |
| German Russians | 1.5 /100 | #255 | Tragic 26.8% |
| Scotch-Irish | 1.4 /100 | #256 | Tragic 26.8% |
| Slavs | 1.3 /100 | #257 | Tragic 26.8% |
| Immigrants | Cuba | 1.3 /100 | #258 | Tragic 26.8% |
| Immigrants | Lithuania | 1.2 /100 | #259 | Tragic 26.8% |
| Immigrants | Jamaica | 1.2 /100 | #260 | Tragic 26.8% |
| Immigrants | Belarus | 1.1 /100 | #261 | Tragic 26.8% |
| Immigrants | Russia | 1.0 /100 | #262 | Tragic 26.8% |
| Immigrants | North Macedonia | 1.0 /100 | #263 | Tragic 26.7% |
| Taiwanese | 0.9 /100 | #264 | Tragic 26.7% |
| Chippewa | 0.9 /100 | #265 | Tragic 26.7% |
| Maltese | 0.9 /100 | #266 | Tragic 26.7% |
| Immigrants | Uzbekistan | 0.9 /100 | #267 | Tragic 26.7% |
| Immigrants | Belgium | 0.9 /100 | #268 | Tragic 26.7% |