Immigrants from Pakistan vs Immigrants from Belarus Hearing Disability
COMPARE
Immigrants from Pakistan
Immigrants from Belarus
Hearing Disability
Hearing Disability Comparison
Immigrants from Pakistan
Immigrants from Belarus
2.6%
HEARING DISABILITY
99.6/ 100
METRIC RATING
34th/ 347
METRIC RANK
2.8%
HEARING DISABILITY
91.6/ 100
METRIC RATING
113th/ 347
METRIC RANK
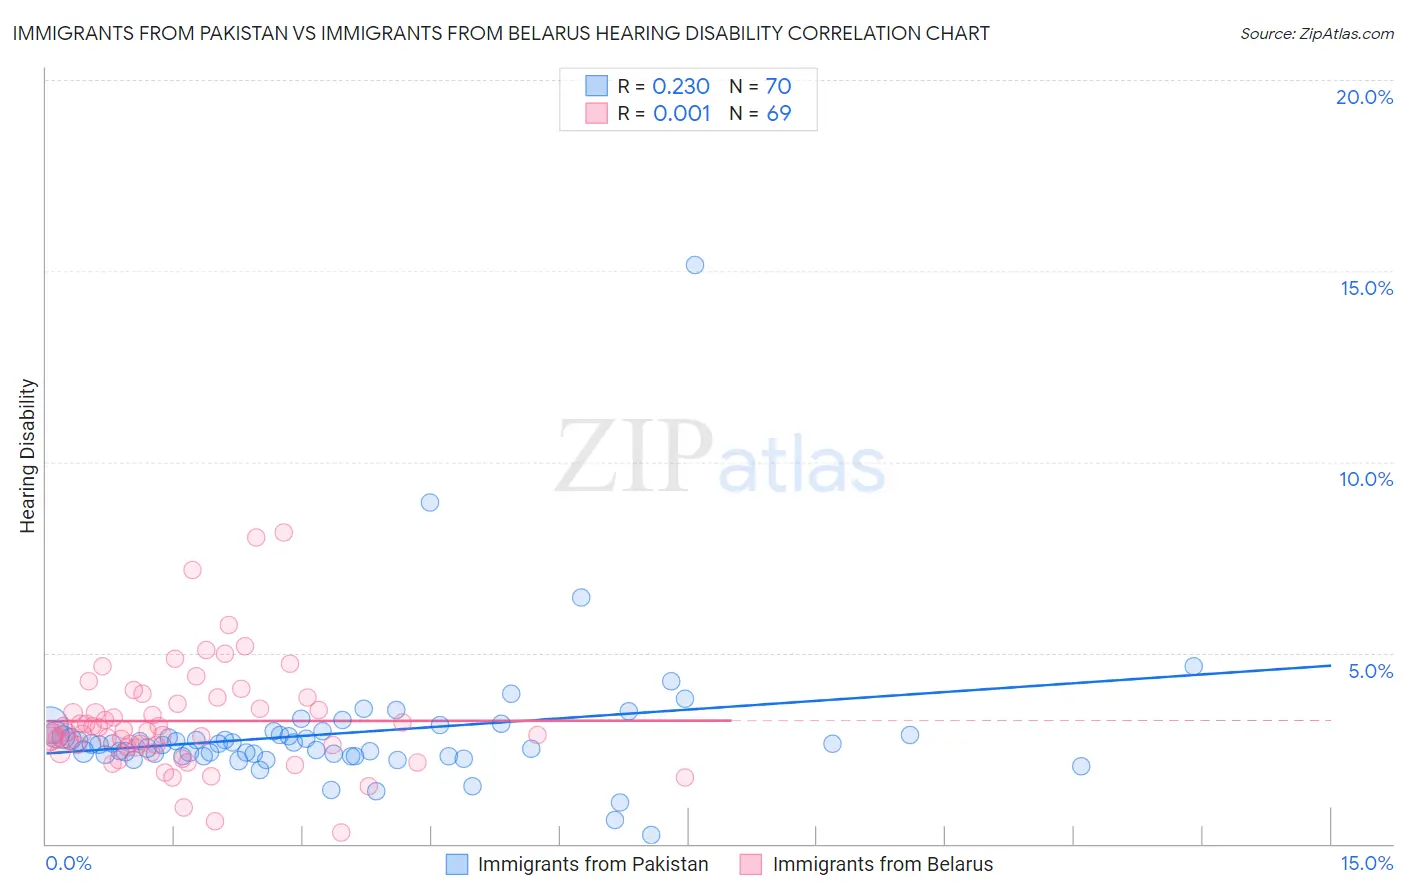
Immigrants from Pakistan vs Immigrants from Belarus Hearing Disability Correlation Chart
The statistical analysis conducted on geographies consisting of 283,855,672 people shows a weak positive correlation between the proportion of Immigrants from Pakistan and percentage of population with hearing disability in the United States with a correlation coefficient (R) of 0.230 and weighted average of 2.6%. Similarly, the statistical analysis conducted on geographies consisting of 150,178,365 people shows no correlation between the proportion of Immigrants from Belarus and percentage of population with hearing disability in the United States with a correlation coefficient (R) of 0.001 and weighted average of 2.8%, a difference of 8.5%.
Hearing Disability Correlation Summary
| Measurement | Immigrants from Pakistan | Immigrants from Belarus |
| Minimum | 0.24% | 0.28% |
| Maximum | 15.2% | 8.1% |
| Range | 14.9% | 7.9% |
| Mean | 2.9% | 3.2% |
| Median | 2.6% | 2.9% |
| Interquartile 25% (IQ1) | 2.3% | 2.5% |
| Interquartile 75% (IQ3) | 2.9% | 3.7% |
| Interquartile Range (IQR) | 0.56% | 1.2% |
| Standard Deviation (Sample) | 1.9% | 1.4% |
| Standard Deviation (Population) | 1.9% | 1.4% |
Similar Demographics by Hearing Disability
Demographics Similar to Immigrants from Pakistan by Hearing Disability
In terms of hearing disability, the demographic groups most similar to Immigrants from Pakistan are Filipino (2.6%, a difference of 0.040%), Salvadoran (2.6%, a difference of 0.12%), Immigrants from Venezuela (2.6%, a difference of 0.30%), Okinawan (2.6%, a difference of 0.35%), and Immigrants from Western Africa (2.6%, a difference of 0.37%).
| Demographics | Rating | Rank | Hearing Disability |
| Immigrants | South Central Asia | 99.7 /100 | #27 | Exceptional 2.6% |
| Immigrants | Haiti | 99.7 /100 | #28 | Exceptional 2.6% |
| Bolivians | 99.7 /100 | #29 | Exceptional 2.6% |
| Immigrants | Caribbean | 99.7 /100 | #30 | Exceptional 2.6% |
| Immigrants | Cameroon | 99.7 /100 | #31 | Exceptional 2.6% |
| Immigrants | Venezuela | 99.7 /100 | #32 | Exceptional 2.6% |
| Filipinos | 99.6 /100 | #33 | Exceptional 2.6% |
| Immigrants | Pakistan | 99.6 /100 | #34 | Exceptional 2.6% |
| Salvadorans | 99.6 /100 | #35 | Exceptional 2.6% |
| Okinawans | 99.6 /100 | #36 | Exceptional 2.6% |
| Immigrants | Western Africa | 99.6 /100 | #37 | Exceptional 2.6% |
| Immigrants | Jamaica | 99.5 /100 | #38 | Exceptional 2.6% |
| Immigrants | China | 99.5 /100 | #39 | Exceptional 2.6% |
| Haitians | 99.5 /100 | #40 | Exceptional 2.6% |
| Immigrants | Taiwan | 99.4 /100 | #41 | Exceptional 2.6% |
Demographics Similar to Immigrants from Belarus by Hearing Disability
In terms of hearing disability, the demographic groups most similar to Immigrants from Belarus are Cambodian (2.8%, a difference of 0.17%), U.S. Virgin Islander (2.8%, a difference of 0.31%), Immigrants from Latin America (2.8%, a difference of 0.34%), Immigrants from Yemen (2.8%, a difference of 0.39%), and Immigrants (2.8%, a difference of 0.41%).
| Demographics | Rating | Rank | Hearing Disability |
| Hondurans | 93.4 /100 | #106 | Exceptional 2.8% |
| Immigrants | Chile | 93.4 /100 | #107 | Exceptional 2.8% |
| Guatemalans | 93.2 /100 | #108 | Exceptional 2.8% |
| Turks | 93.0 /100 | #109 | Exceptional 2.8% |
| Cypriots | 92.9 /100 | #110 | Exceptional 2.8% |
| Immigrants | Yemen | 92.7 /100 | #111 | Exceptional 2.8% |
| U.S. Virgin Islanders | 92.5 /100 | #112 | Exceptional 2.8% |
| Immigrants | Belarus | 91.6 /100 | #113 | Exceptional 2.8% |
| Cambodians | 91.1 /100 | #114 | Exceptional 2.8% |
| Immigrants | Latin America | 90.5 /100 | #115 | Exceptional 2.8% |
| Immigrants | Immigrants | 90.3 /100 | #116 | Exceptional 2.8% |
| Immigrants | Liberia | 90.0 /100 | #117 | Excellent 2.8% |
| Zimbabweans | 89.9 /100 | #118 | Excellent 2.8% |
| Kenyans | 89.8 /100 | #119 | Excellent 2.8% |
| Jordanians | 89.5 /100 | #120 | Excellent 2.8% |