Yuman vs Maltese Hearing Disability
COMPARE
Yuman
Maltese
Hearing Disability
Hearing Disability Comparison
Yuman
Maltese
3.4%
HEARING DISABILITY
0.4/ 100
METRIC RATING
250th/ 347
METRIC RANK
3.2%
HEARING DISABILITY
4.1/ 100
METRIC RATING
229th/ 347
METRIC RANK
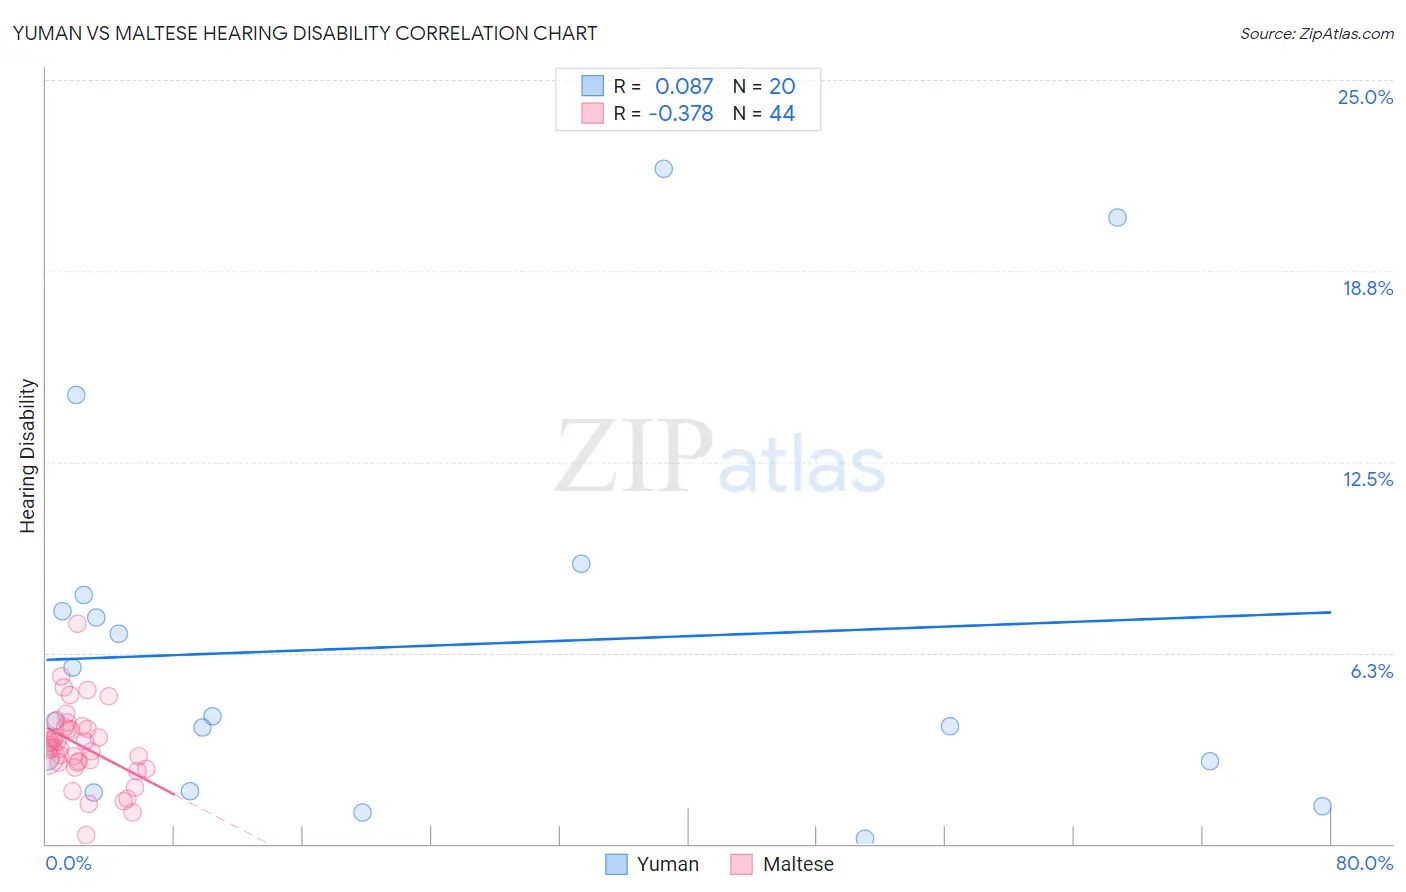
Yuman vs Maltese Hearing Disability Correlation Chart
The statistical analysis conducted on geographies consisting of 40,662,882 people shows a slight positive correlation between the proportion of Yuman and percentage of population with hearing disability in the United States with a correlation coefficient (R) of 0.087 and weighted average of 3.4%. Similarly, the statistical analysis conducted on geographies consisting of 126,465,579 people shows a mild negative correlation between the proportion of Maltese and percentage of population with hearing disability in the United States with a correlation coefficient (R) of -0.378 and weighted average of 3.2%, a difference of 5.0%.
Hearing Disability Correlation Summary
| Measurement | Yuman | Maltese |
| Minimum | 0.16% | 0.30% |
| Maximum | 22.1% | 7.2% |
| Range | 22.0% | 6.9% |
| Mean | 6.5% | 3.2% |
| Median | 4.1% | 3.2% |
| Interquartile 25% (IQ1) | 2.2% | 2.7% |
| Interquartile 75% (IQ3) | 7.9% | 3.8% |
| Interquartile Range (IQR) | 5.7% | 1.1% |
| Standard Deviation (Sample) | 6.1% | 1.3% |
| Standard Deviation (Population) | 6.0% | 1.2% |
Similar Demographics by Hearing Disability
Demographics Similar to Yuman by Hearing Disability
In terms of hearing disability, the demographic groups most similar to Yuman are Italian (3.4%, a difference of 0.010%), Hungarian (3.4%, a difference of 0.23%), Croatian (3.4%, a difference of 0.44%), Austrian (3.4%, a difference of 0.54%), and Lithuanian (3.4%, a difference of 0.76%).
| Demographics | Rating | Rank | Hearing Disability |
| Immigrants | Western Europe | 1.0 /100 | #243 | Tragic 3.3% |
| Assyrians/Chaldeans/Syriacs | 0.9 /100 | #244 | Tragic 3.3% |
| Immigrants | Scotland | 0.8 /100 | #245 | Tragic 3.3% |
| Immigrants | England | 0.7 /100 | #246 | Tragic 3.3% |
| Lithuanians | 0.6 /100 | #247 | Tragic 3.4% |
| Austrians | 0.6 /100 | #248 | Tragic 3.4% |
| Italians | 0.4 /100 | #249 | Tragic 3.4% |
| Yuman | 0.4 /100 | #250 | Tragic 3.4% |
| Hungarians | 0.4 /100 | #251 | Tragic 3.4% |
| Croatians | 0.4 /100 | #252 | Tragic 3.4% |
| Carpatho Rusyns | 0.3 /100 | #253 | Tragic 3.4% |
| Slavs | 0.2 /100 | #254 | Tragic 3.4% |
| Poles | 0.2 /100 | #255 | Tragic 3.4% |
| Hmong | 0.2 /100 | #256 | Tragic 3.4% |
| Yaqui | 0.2 /100 | #257 | Tragic 3.4% |
Demographics Similar to Maltese by Hearing Disability
In terms of hearing disability, the demographic groups most similar to Maltese are Immigrants from Portugal (3.2%, a difference of 0.11%), Bhutanese (3.2%, a difference of 0.30%), Lebanese (3.2%, a difference of 0.49%), Greek (3.2%, a difference of 0.51%), and Latvian (3.2%, a difference of 0.53%).
| Demographics | Rating | Rank | Hearing Disability |
| Immigrants | Oceania | 6.5 /100 | #222 | Tragic 3.2% |
| Mexicans | 5.6 /100 | #223 | Tragic 3.2% |
| Icelanders | 5.2 /100 | #224 | Tragic 3.2% |
| Latvians | 5.1 /100 | #225 | Tragic 3.2% |
| Lebanese | 5.0 /100 | #226 | Tragic 3.2% |
| Bhutanese | 4.6 /100 | #227 | Tragic 3.2% |
| Immigrants | Portugal | 4.3 /100 | #228 | Tragic 3.2% |
| Maltese | 4.1 /100 | #229 | Tragic 3.2% |
| Greeks | 3.2 /100 | #230 | Tragic 3.2% |
| Luxembourgers | 2.9 /100 | #231 | Tragic 3.2% |
| Ukrainians | 2.9 /100 | #232 | Tragic 3.2% |
| Estonians | 2.4 /100 | #233 | Tragic 3.3% |
| Central American Indians | 2.3 /100 | #234 | Tragic 3.3% |
| Guamanians/Chamorros | 2.2 /100 | #235 | Tragic 3.3% |
| Serbians | 2.2 /100 | #236 | Tragic 3.3% |