Paiute vs Comanche Disability Age Over 75
COMPARE
Paiute
Comanche
Disability Age Over 75
Disability Age Over 75 Comparison
Paiute
Comanche
51.5%
DISABILITY AGE OVER 75
0.0/ 100
METRIC RATING
320th/ 347
METRIC RANK
51.7%
DISABILITY AGE OVER 75
0.0/ 100
METRIC RATING
322nd/ 347
METRIC RANK
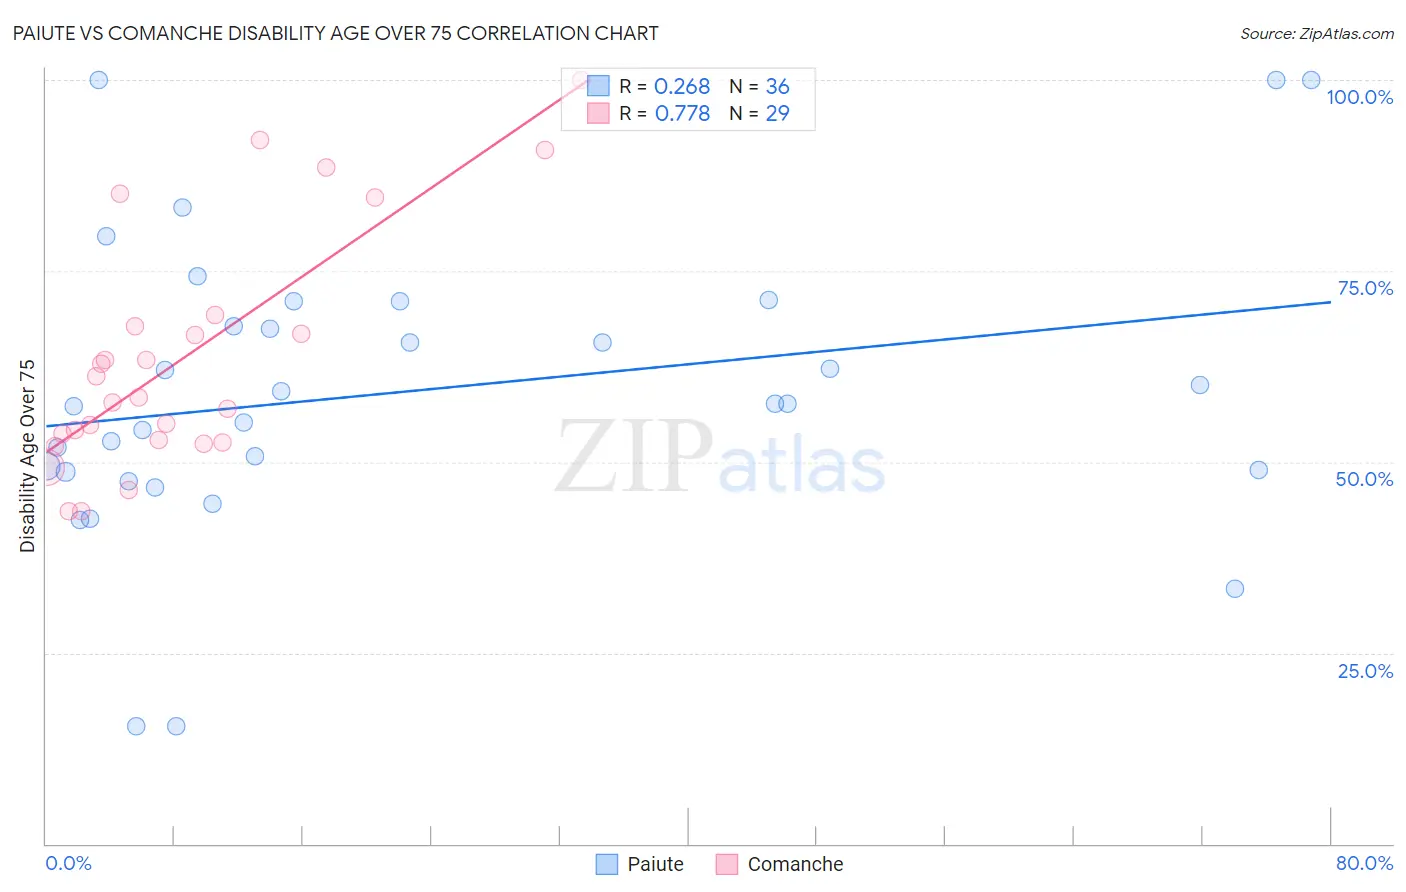
Paiute vs Comanche Disability Age Over 75 Correlation Chart
The statistical analysis conducted on geographies consisting of 58,388,760 people shows a weak positive correlation between the proportion of Paiute and percentage of population with a disability over the age of 75 in the United States with a correlation coefficient (R) of 0.268 and weighted average of 51.5%. Similarly, the statistical analysis conducted on geographies consisting of 109,684,350 people shows a strong positive correlation between the proportion of Comanche and percentage of population with a disability over the age of 75 in the United States with a correlation coefficient (R) of 0.778 and weighted average of 51.7%, a difference of 0.34%.
Disability Age Over 75 Correlation Summary
| Measurement | Paiute | Comanche |
| Minimum | 15.4% | 43.6% |
| Maximum | 100.0% | 100.0% |
| Range | 84.6% | 56.4% |
| Mean | 59.2% | 63.7% |
| Median | 57.7% | 58.4% |
| Interquartile 25% (IQ1) | 48.8% | 52.7% |
| Interquartile 75% (IQ3) | 69.4% | 68.5% |
| Interquartile Range (IQR) | 20.6% | 15.8% |
| Standard Deviation (Sample) | 19.3% | 15.5% |
| Standard Deviation (Population) | 19.0% | 15.2% |
Demographics Similar to Paiute and Comanche by Disability Age Over 75
In terms of disability age over 75, the demographic groups most similar to Paiute are Dutch West Indian (51.5%, a difference of 0.0%), Seminole (51.5%, a difference of 0.14%), Creek (51.5%, a difference of 0.14%), Yakama (51.3%, a difference of 0.47%), and Chickasaw (51.2%, a difference of 0.65%). Similarly, the demographic groups most similar to Comanche are Dutch West Indian (51.5%, a difference of 0.34%), Creek (51.5%, a difference of 0.48%), Seminole (51.5%, a difference of 0.49%), Immigrants from Yemen (52.0%, a difference of 0.52%), and Yakama (51.3%, a difference of 0.82%).
| Demographics | Rating | Rank | Disability Age Over 75 |
| Cajuns | 0.0 /100 | #311 | Tragic 50.7% |
| Cheyenne | 0.0 /100 | #312 | Tragic 50.9% |
| Immigrants | Azores | 0.0 /100 | #313 | Tragic 50.9% |
| Immigrants | Mexico | 0.0 /100 | #314 | Tragic 51.1% |
| Mexicans | 0.0 /100 | #315 | Tragic 51.1% |
| Chickasaw | 0.0 /100 | #316 | Tragic 51.2% |
| Yakama | 0.0 /100 | #317 | Tragic 51.3% |
| Seminole | 0.0 /100 | #318 | Tragic 51.5% |
| Creek | 0.0 /100 | #319 | Tragic 51.5% |
| Paiute | 0.0 /100 | #320 | Tragic 51.5% |
| Dutch West Indians | 0.0 /100 | #321 | Tragic 51.5% |
| Comanche | 0.0 /100 | #322 | Tragic 51.7% |
| Immigrants | Yemen | 0.0 /100 | #323 | Tragic 52.0% |
| Menominee | 0.0 /100 | #324 | Tragic 52.3% |
| Immigrants | Cabo Verde | 0.0 /100 | #325 | Tragic 52.4% |
| Ute | 0.0 /100 | #326 | Tragic 52.6% |
| Nepalese | 0.0 /100 | #327 | Tragic 52.6% |
| Choctaw | 0.0 /100 | #328 | Tragic 52.7% |
| Alaska Natives | 0.0 /100 | #329 | Tragic 52.8% |
| Puerto Ricans | 0.0 /100 | #330 | Tragic 52.9% |
| Hopi | 0.0 /100 | #331 | Tragic 52.9% |