Aleut vs Comanche Disability Age Over 75
COMPARE
Aleut
Comanche
Disability Age Over 75
Disability Age Over 75 Comparison
Aleuts
Comanche
50.6%
DISABILITY AGE OVER 75
0.0/ 100
METRIC RATING
309th/ 347
METRIC RANK
51.7%
DISABILITY AGE OVER 75
0.0/ 100
METRIC RATING
322nd/ 347
METRIC RANK
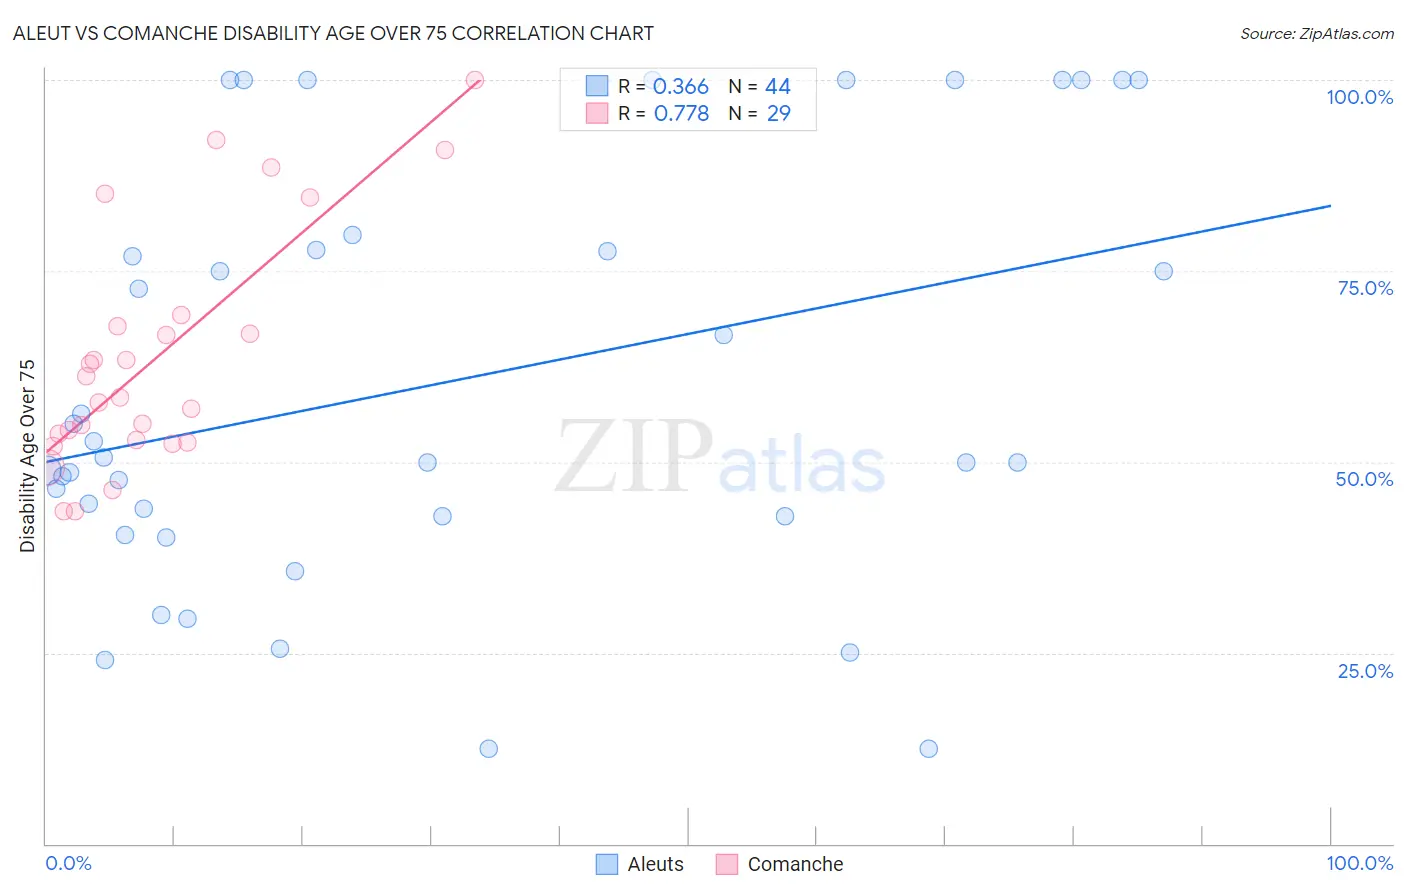
Aleut vs Comanche Disability Age Over 75 Correlation Chart
The statistical analysis conducted on geographies consisting of 61,756,409 people shows a mild positive correlation between the proportion of Aleuts and percentage of population with a disability over the age of 75 in the United States with a correlation coefficient (R) of 0.366 and weighted average of 50.6%. Similarly, the statistical analysis conducted on geographies consisting of 109,684,350 people shows a strong positive correlation between the proportion of Comanche and percentage of population with a disability over the age of 75 in the United States with a correlation coefficient (R) of 0.778 and weighted average of 51.7%, a difference of 2.2%.
Disability Age Over 75 Correlation Summary
| Measurement | Aleut | Comanche |
| Minimum | 12.5% | 43.6% |
| Maximum | 100.0% | 100.0% |
| Range | 87.5% | 56.4% |
| Mean | 60.3% | 63.7% |
| Median | 50.3% | 58.4% |
| Interquartile 25% (IQ1) | 42.9% | 52.7% |
| Interquartile 75% (IQ3) | 78.7% | 68.5% |
| Interquartile Range (IQR) | 35.9% | 15.8% |
| Standard Deviation (Sample) | 27.1% | 15.5% |
| Standard Deviation (Population) | 26.8% | 15.2% |
Demographics Similar to Aleuts and Comanche by Disability Age Over 75
In terms of disability age over 75, the demographic groups most similar to Aleuts are Hispanic or Latino (50.6%, a difference of 0.0%), Immigrants from Fiji (50.6%, a difference of 0.030%), Tlingit-Haida (50.6%, a difference of 0.040%), Immigrants from Central America (50.5%, a difference of 0.080%), and Cajun (50.7%, a difference of 0.14%). Similarly, the demographic groups most similar to Comanche are Paiute (51.5%, a difference of 0.34%), Dutch West Indian (51.5%, a difference of 0.34%), Creek (51.5%, a difference of 0.48%), Seminole (51.5%, a difference of 0.49%), and Immigrants from Yemen (52.0%, a difference of 0.52%).
| Demographics | Rating | Rank | Disability Age Over 75 |
| Central American Indians | 0.0 /100 | #305 | Tragic 50.5% |
| Immigrants | Central America | 0.0 /100 | #306 | Tragic 50.5% |
| Immigrants | Fiji | 0.0 /100 | #307 | Tragic 50.6% |
| Hispanics or Latinos | 0.0 /100 | #308 | Tragic 50.6% |
| Aleuts | 0.0 /100 | #309 | Tragic 50.6% |
| Tlingit-Haida | 0.0 /100 | #310 | Tragic 50.6% |
| Cajuns | 0.0 /100 | #311 | Tragic 50.7% |
| Cheyenne | 0.0 /100 | #312 | Tragic 50.9% |
| Immigrants | Azores | 0.0 /100 | #313 | Tragic 50.9% |
| Immigrants | Mexico | 0.0 /100 | #314 | Tragic 51.1% |
| Mexicans | 0.0 /100 | #315 | Tragic 51.1% |
| Chickasaw | 0.0 /100 | #316 | Tragic 51.2% |
| Yakama | 0.0 /100 | #317 | Tragic 51.3% |
| Seminole | 0.0 /100 | #318 | Tragic 51.5% |
| Creek | 0.0 /100 | #319 | Tragic 51.5% |
| Paiute | 0.0 /100 | #320 | Tragic 51.5% |
| Dutch West Indians | 0.0 /100 | #321 | Tragic 51.5% |
| Comanche | 0.0 /100 | #322 | Tragic 51.7% |
| Immigrants | Yemen | 0.0 /100 | #323 | Tragic 52.0% |
| Menominee | 0.0 /100 | #324 | Tragic 52.3% |
| Immigrants | Cabo Verde | 0.0 /100 | #325 | Tragic 52.4% |