Yakama vs Immigrants from Saudi Arabia Disability Age 35 to 64
COMPARE
Yakama
Immigrants from Saudi Arabia
Disability Age 35 to 64
Disability Age 35 to 64 Comparison
Yakama
Immigrants from Saudi Arabia
13.6%
DISABILITY AGE 35 TO 64
0.0/ 100
METRIC RATING
295th/ 347
METRIC RANK
10.8%
DISABILITY AGE 35 TO 64
90.6/ 100
METRIC RATING
142nd/ 347
METRIC RANK
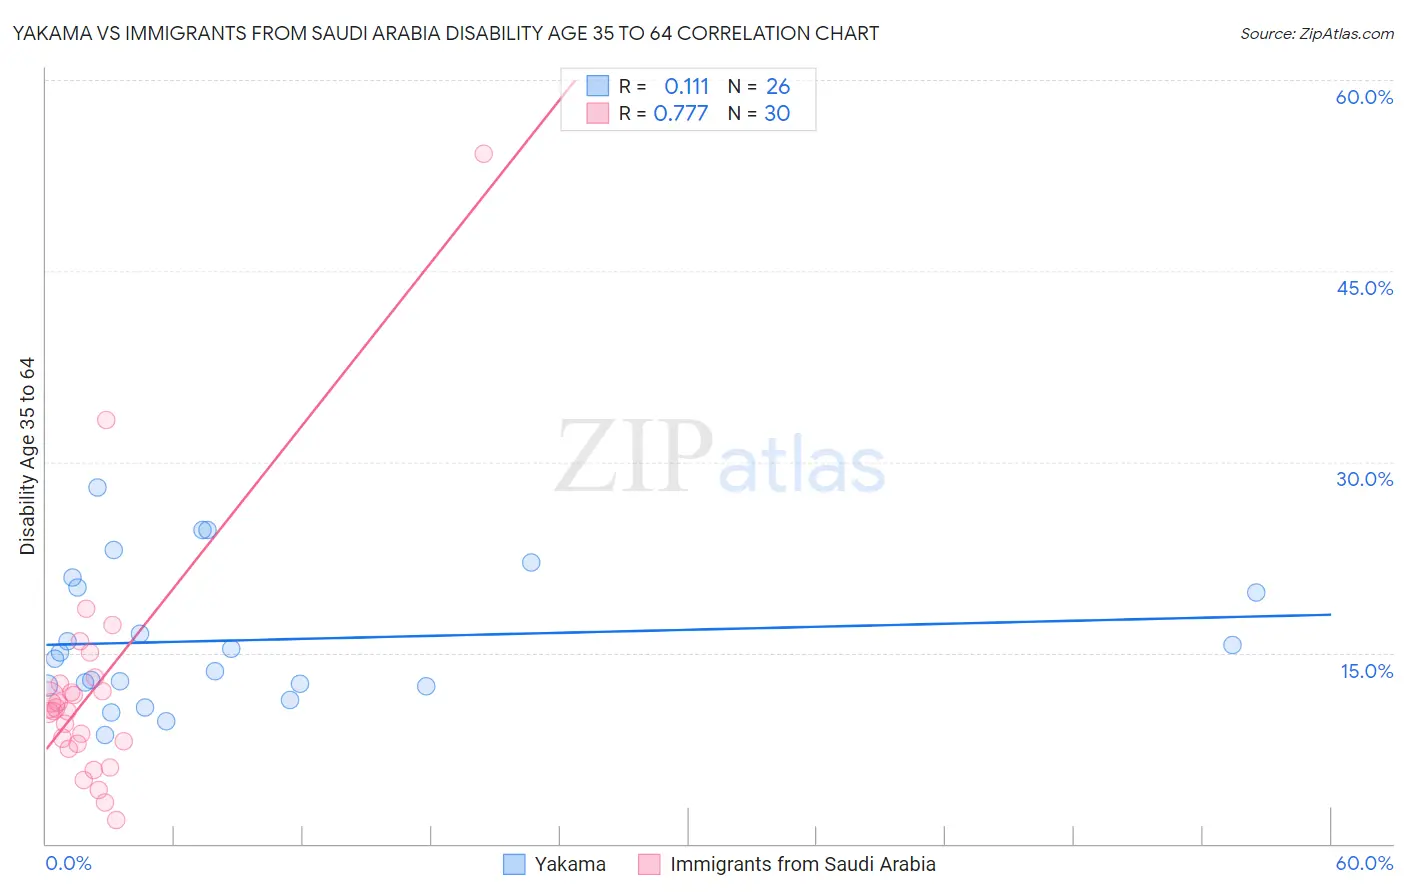
Yakama vs Immigrants from Saudi Arabia Disability Age 35 to 64 Correlation Chart
The statistical analysis conducted on geographies consisting of 19,917,759 people shows a poor positive correlation between the proportion of Yakama and percentage of population with a disability between the ages 34 and 64 in the United States with a correlation coefficient (R) of 0.111 and weighted average of 13.6%. Similarly, the statistical analysis conducted on geographies consisting of 164,212,141 people shows a strong positive correlation between the proportion of Immigrants from Saudi Arabia and percentage of population with a disability between the ages 34 and 64 in the United States with a correlation coefficient (R) of 0.777 and weighted average of 10.8%, a difference of 26.0%.
Disability Age 35 to 64 Correlation Summary
| Measurement | Yakama | Immigrants from Saudi Arabia |
| Minimum | 8.6% | 1.9% |
| Maximum | 28.0% | 54.2% |
| Range | 19.4% | 52.3% |
| Mean | 16.0% | 12.2% |
| Median | 14.8% | 10.6% |
| Interquartile 25% (IQ1) | 12.4% | 7.9% |
| Interquartile 75% (IQ3) | 20.1% | 12.6% |
| Interquartile Range (IQR) | 7.7% | 4.7% |
| Standard Deviation (Sample) | 5.3% | 9.8% |
| Standard Deviation (Population) | 5.2% | 9.6% |
Similar Demographics by Disability Age 35 to 64
Demographics Similar to Yakama by Disability Age 35 to 64
In terms of disability age 35 to 64, the demographic groups most similar to Yakama are African (13.6%, a difference of 0.22%), Bangladeshi (13.6%, a difference of 0.57%), Cheyenne (13.6%, a difference of 0.60%), Yaqui (13.5%, a difference of 0.68%), and Spanish American (13.7%, a difference of 0.80%).
| Demographics | Rating | Rank | Disability Age 35 to 64 |
| Fijians | 0.0 /100 | #288 | Tragic 13.2% |
| Indonesians | 0.0 /100 | #289 | Tragic 13.2% |
| Immigrants | Liberia | 0.0 /100 | #290 | Tragic 13.2% |
| Immigrants | Congo | 0.0 /100 | #291 | Tragic 13.3% |
| Puget Sound Salish | 0.0 /100 | #292 | Tragic 13.3% |
| Ute | 0.0 /100 | #293 | Tragic 13.4% |
| Yaqui | 0.0 /100 | #294 | Tragic 13.5% |
| Yakama | 0.0 /100 | #295 | Tragic 13.6% |
| Africans | 0.0 /100 | #296 | Tragic 13.6% |
| Bangladeshis | 0.0 /100 | #297 | Tragic 13.6% |
| Cheyenne | 0.0 /100 | #298 | Tragic 13.6% |
| Spanish Americans | 0.0 /100 | #299 | Tragic 13.7% |
| Delaware | 0.0 /100 | #300 | Tragic 13.7% |
| French American Indians | 0.0 /100 | #301 | Tragic 13.7% |
| Aleuts | 0.0 /100 | #302 | Tragic 13.8% |
Demographics Similar to Immigrants from Saudi Arabia by Disability Age 35 to 64
In terms of disability age 35 to 64, the demographic groups most similar to Immigrants from Saudi Arabia are Australian (10.8%, a difference of 0.040%), Immigrants from Scotland (10.7%, a difference of 0.17%), Sierra Leonean (10.8%, a difference of 0.21%), Costa Rican (10.7%, a difference of 0.22%), and Immigrants from Southern Europe (10.7%, a difference of 0.23%).
| Demographics | Rating | Rank | Disability Age 35 to 64 |
| Greeks | 92.3 /100 | #135 | Exceptional 10.7% |
| Salvadorans | 91.9 /100 | #136 | Exceptional 10.7% |
| Immigrants | Costa Rica | 91.7 /100 | #137 | Exceptional 10.7% |
| Immigrants | Southern Europe | 91.5 /100 | #138 | Exceptional 10.7% |
| Costa Ricans | 91.4 /100 | #139 | Exceptional 10.7% |
| Immigrants | Scotland | 91.3 /100 | #140 | Exceptional 10.7% |
| Australians | 90.7 /100 | #141 | Exceptional 10.8% |
| Immigrants | Saudi Arabia | 90.6 /100 | #142 | Exceptional 10.8% |
| Sierra Leoneans | 89.7 /100 | #143 | Excellent 10.8% |
| Lithuanians | 88.7 /100 | #144 | Excellent 10.8% |
| Immigrants | Bangladesh | 85.6 /100 | #145 | Excellent 10.9% |
| South American Indians | 83.5 /100 | #146 | Excellent 10.9% |
| Immigrants | Eritrea | 83.4 /100 | #147 | Excellent 10.9% |
| Arabs | 82.7 /100 | #148 | Excellent 10.9% |
| Immigrants | Cameroon | 81.1 /100 | #149 | Excellent 10.9% |