Yakama vs Immigrants from Haiti Disability Age 35 to 64
COMPARE
Yakama
Immigrants from Haiti
Disability Age 35 to 64
Disability Age 35 to 64 Comparison
Yakama
Immigrants from Haiti
13.6%
DISABILITY AGE 35 TO 64
0.0/ 100
METRIC RATING
295th/ 347
METRIC RANK
11.1%
DISABILITY AGE 35 TO 64
63.8/ 100
METRIC RATING
166th/ 347
METRIC RANK
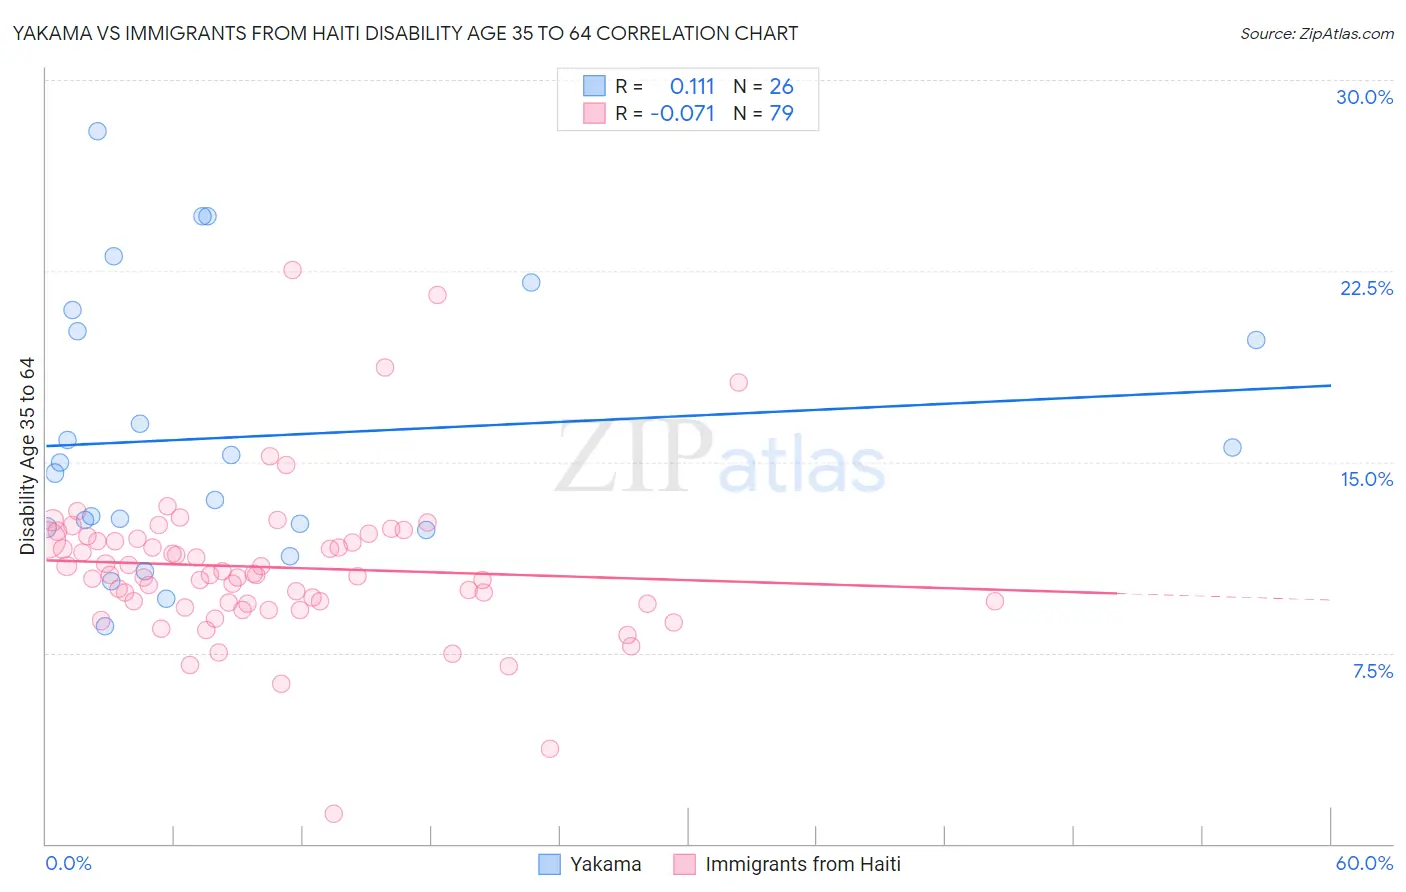
Yakama vs Immigrants from Haiti Disability Age 35 to 64 Correlation Chart
The statistical analysis conducted on geographies consisting of 19,917,759 people shows a poor positive correlation between the proportion of Yakama and percentage of population with a disability between the ages 34 and 64 in the United States with a correlation coefficient (R) of 0.111 and weighted average of 13.6%. Similarly, the statistical analysis conducted on geographies consisting of 225,154,899 people shows a slight negative correlation between the proportion of Immigrants from Haiti and percentage of population with a disability between the ages 34 and 64 in the United States with a correlation coefficient (R) of -0.071 and weighted average of 11.1%, a difference of 21.6%.
Disability Age 35 to 64 Correlation Summary
| Measurement | Yakama | Immigrants from Haiti |
| Minimum | 8.6% | 1.2% |
| Maximum | 28.0% | 22.5% |
| Range | 19.4% | 21.4% |
| Mean | 16.0% | 10.9% |
| Median | 14.8% | 10.6% |
| Interquartile 25% (IQ1) | 12.4% | 9.4% |
| Interquartile 75% (IQ3) | 20.1% | 12.0% |
| Interquartile Range (IQR) | 7.7% | 2.5% |
| Standard Deviation (Sample) | 5.3% | 3.1% |
| Standard Deviation (Population) | 5.2% | 3.1% |
Similar Demographics by Disability Age 35 to 64
Demographics Similar to Yakama by Disability Age 35 to 64
In terms of disability age 35 to 64, the demographic groups most similar to Yakama are African (13.6%, a difference of 0.22%), Bangladeshi (13.6%, a difference of 0.57%), Cheyenne (13.6%, a difference of 0.60%), Yaqui (13.5%, a difference of 0.68%), and Spanish American (13.7%, a difference of 0.80%).
| Demographics | Rating | Rank | Disability Age 35 to 64 |
| Fijians | 0.0 /100 | #288 | Tragic 13.2% |
| Indonesians | 0.0 /100 | #289 | Tragic 13.2% |
| Immigrants | Liberia | 0.0 /100 | #290 | Tragic 13.2% |
| Immigrants | Congo | 0.0 /100 | #291 | Tragic 13.3% |
| Puget Sound Salish | 0.0 /100 | #292 | Tragic 13.3% |
| Ute | 0.0 /100 | #293 | Tragic 13.4% |
| Yaqui | 0.0 /100 | #294 | Tragic 13.5% |
| Yakama | 0.0 /100 | #295 | Tragic 13.6% |
| Africans | 0.0 /100 | #296 | Tragic 13.6% |
| Bangladeshis | 0.0 /100 | #297 | Tragic 13.6% |
| Cheyenne | 0.0 /100 | #298 | Tragic 13.6% |
| Spanish Americans | 0.0 /100 | #299 | Tragic 13.7% |
| Delaware | 0.0 /100 | #300 | Tragic 13.7% |
| French American Indians | 0.0 /100 | #301 | Tragic 13.7% |
| Aleuts | 0.0 /100 | #302 | Tragic 13.8% |
Demographics Similar to Immigrants from Haiti by Disability Age 35 to 64
In terms of disability age 35 to 64, the demographic groups most similar to Immigrants from Haiti are Austrian (11.1%, a difference of 0.050%), Immigrants from Western Europe (11.1%, a difference of 0.12%), Pakistani (11.1%, a difference of 0.17%), Immigrants from St. Vincent and the Grenadines (11.1%, a difference of 0.25%), and Immigrants from Grenada (11.1%, a difference of 0.41%).
| Demographics | Rating | Rank | Disability Age 35 to 64 |
| Serbians | 73.6 /100 | #159 | Good 11.0% |
| Croatians | 73.1 /100 | #160 | Good 11.0% |
| Immigrants | Guyana | 70.1 /100 | #161 | Good 11.1% |
| Immigrants | Grenada | 68.4 /100 | #162 | Good 11.1% |
| Immigrants | St. Vincent and the Grenadines | 66.6 /100 | #163 | Good 11.1% |
| Pakistanis | 65.8 /100 | #164 | Good 11.1% |
| Immigrants | Western Europe | 65.2 /100 | #165 | Good 11.1% |
| Immigrants | Haiti | 63.8 /100 | #166 | Good 11.1% |
| Austrians | 63.2 /100 | #167 | Good 11.1% |
| Central Americans | 59.1 /100 | #168 | Average 11.2% |
| Haitians | 59.0 /100 | #169 | Average 11.2% |
| Immigrants | Uganda | 58.0 /100 | #170 | Average 11.2% |
| Immigrants | Trinidad and Tobago | 55.9 /100 | #171 | Average 11.2% |
| Italians | 55.6 /100 | #172 | Average 11.2% |
| Lebanese | 51.8 /100 | #173 | Average 11.3% |