Tohono O'odham vs Soviet Union Cognitive Disability
COMPARE
Tohono O'odham
Soviet Union
Cognitive Disability
Cognitive Disability Comparison
Tohono O'odham
Soviet Union
19.3%
COGNITIVE DISABILITY
0.0/ 100
METRIC RATING
341st/ 347
METRIC RANK
16.5%
COGNITIVE DISABILITY
99.8/ 100
METRIC RATING
52nd/ 347
METRIC RANK
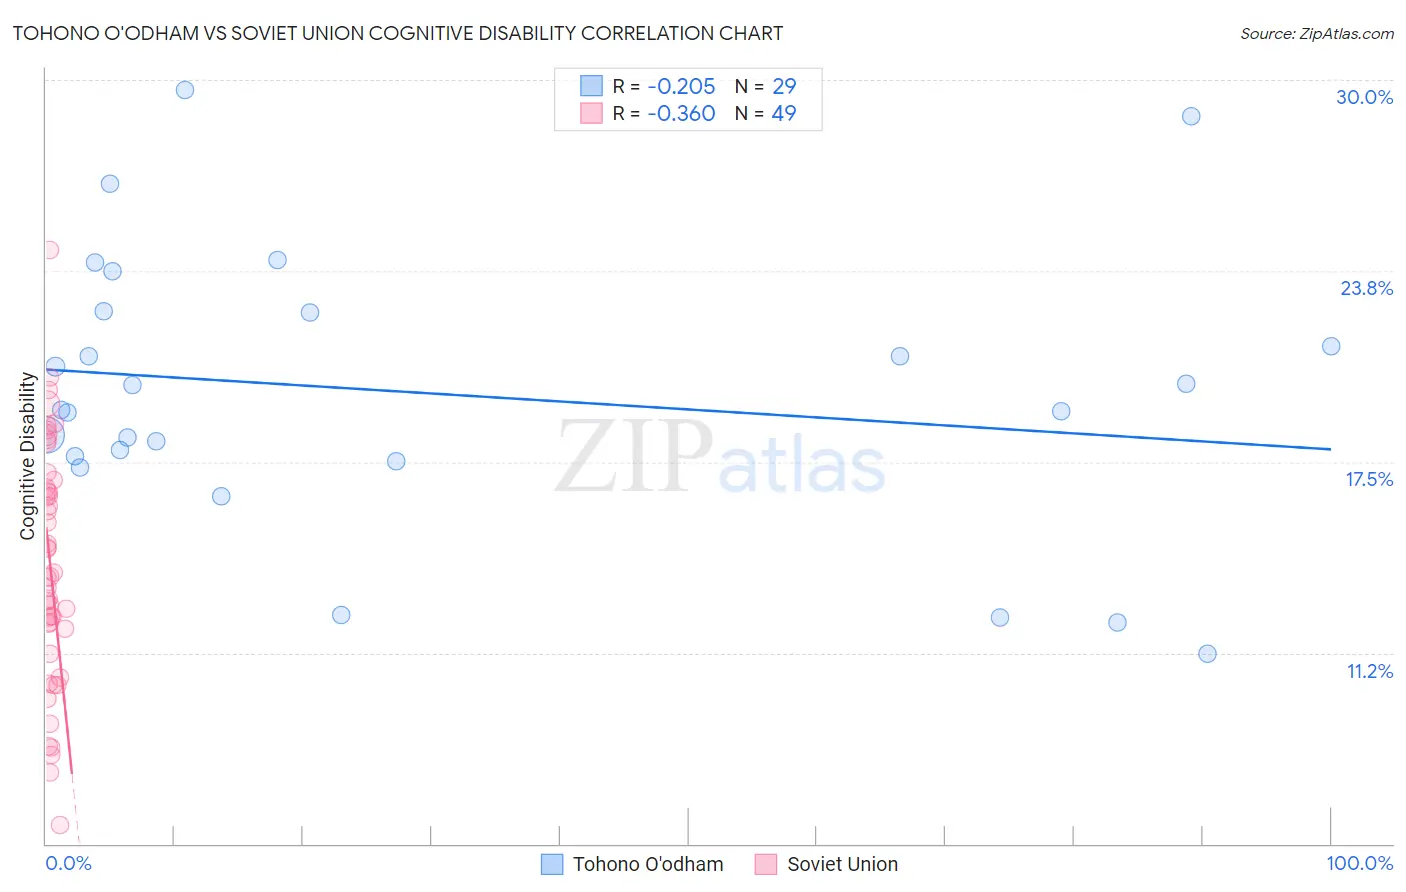
Tohono O'odham vs Soviet Union Cognitive Disability Correlation Chart
The statistical analysis conducted on geographies consisting of 58,725,044 people shows a weak negative correlation between the proportion of Tohono O'odham and percentage of population with cognitive disability in the United States with a correlation coefficient (R) of -0.205 and weighted average of 19.3%. Similarly, the statistical analysis conducted on geographies consisting of 43,504,324 people shows a mild negative correlation between the proportion of Soviet Union and percentage of population with cognitive disability in the United States with a correlation coefficient (R) of -0.360 and weighted average of 16.5%, a difference of 16.6%.
Cognitive Disability Correlation Summary
| Measurement | Tohono O'odham | Soviet Union |
| Minimum | 11.2% | 5.6% |
| Maximum | 29.7% | 24.4% |
| Range | 18.4% | 18.8% |
| Mean | 19.8% | 14.1% |
| Median | 19.2% | 13.7% |
| Interquartile 25% (IQ1) | 17.6% | 11.6% |
| Interquartile 75% (IQ3) | 22.4% | 16.8% |
| Interquartile Range (IQR) | 4.8% | 5.2% |
| Standard Deviation (Sample) | 4.5% | 3.9% |
| Standard Deviation (Population) | 4.4% | 3.9% |
Similar Demographics by Cognitive Disability
Demographics Similar to Tohono O'odham by Cognitive Disability
In terms of cognitive disability, the demographic groups most similar to Tohono O'odham are Houma (19.3%, a difference of 0.0%), Cape Verdean (19.2%, a difference of 0.24%), Puerto Rican (19.2%, a difference of 0.26%), Immigrants from Zaire (19.4%, a difference of 0.69%), and Lumbee (19.1%, a difference of 0.74%).
| Demographics | Rating | Rank | Cognitive Disability |
| Immigrants | Yemen | 0.0 /100 | #333 | Tragic 18.8% |
| Sudanese | 0.0 /100 | #334 | Tragic 18.9% |
| Senegalese | 0.0 /100 | #335 | Tragic 19.0% |
| Blacks/African Americans | 0.0 /100 | #336 | Tragic 19.0% |
| Immigrants | Saudi Arabia | 0.0 /100 | #337 | Tragic 19.1% |
| Lumbee | 0.0 /100 | #338 | Tragic 19.1% |
| Puerto Ricans | 0.0 /100 | #339 | Tragic 19.2% |
| Cape Verdeans | 0.0 /100 | #340 | Tragic 19.2% |
| Tohono O'odham | 0.0 /100 | #341 | Tragic 19.3% |
| Houma | 0.0 /100 | #342 | Tragic 19.3% |
| Immigrants | Zaire | 0.0 /100 | #343 | Tragic 19.4% |
| Immigrants | Congo | 0.0 /100 | #344 | Tragic 19.7% |
| Somalis | 0.0 /100 | #345 | Tragic 19.8% |
| Immigrants | Cabo Verde | 0.0 /100 | #346 | Tragic 19.9% |
| Immigrants | Somalia | 0.0 /100 | #347 | Tragic 20.0% |
Demographics Similar to Soviet Union by Cognitive Disability
In terms of cognitive disability, the demographic groups most similar to Soviet Union are Immigrants from Korea (16.5%, a difference of 0.040%), Swedish (16.5%, a difference of 0.060%), Iranian (16.5%, a difference of 0.090%), Norwegian (16.5%, a difference of 0.090%), and Immigrants from Iran (16.5%, a difference of 0.10%).
| Demographics | Rating | Rank | Cognitive Disability |
| Immigrants | Europe | 99.8 /100 | #45 | Exceptional 16.5% |
| Immigrants | Colombia | 99.8 /100 | #46 | Exceptional 16.5% |
| Immigrants | Italy | 99.8 /100 | #47 | Exceptional 16.5% |
| Immigrants | North America | 99.8 /100 | #48 | Exceptional 16.5% |
| Iranians | 99.8 /100 | #49 | Exceptional 16.5% |
| Norwegians | 99.8 /100 | #50 | Exceptional 16.5% |
| Immigrants | Korea | 99.8 /100 | #51 | Exceptional 16.5% |
| Soviet Union | 99.8 /100 | #52 | Exceptional 16.5% |
| Swedes | 99.8 /100 | #53 | Exceptional 16.5% |
| Immigrants | Iran | 99.8 /100 | #54 | Exceptional 16.5% |
| Immigrants | Venezuela | 99.7 /100 | #55 | Exceptional 16.5% |
| Austrians | 99.7 /100 | #56 | Exceptional 16.6% |
| Bhutanese | 99.7 /100 | #57 | Exceptional 16.6% |
| Pennsylvania Germans | 99.7 /100 | #58 | Exceptional 16.6% |
| Immigrants | Peru | 99.7 /100 | #59 | Exceptional 16.6% |