West Indian vs Immigrants from Yemen Disability Age 65 to 74
COMPARE
West Indian
Immigrants from Yemen
Disability Age 65 to 74
Disability Age 65 to 74 Comparison
West Indians
Immigrants from Yemen
24.5%
DISABILITY AGE 65 TO 74
3.4/ 100
METRIC RATING
237th/ 347
METRIC RANK
27.0%
DISABILITY AGE 65 TO 74
0.0/ 100
METRIC RATING
298th/ 347
METRIC RANK
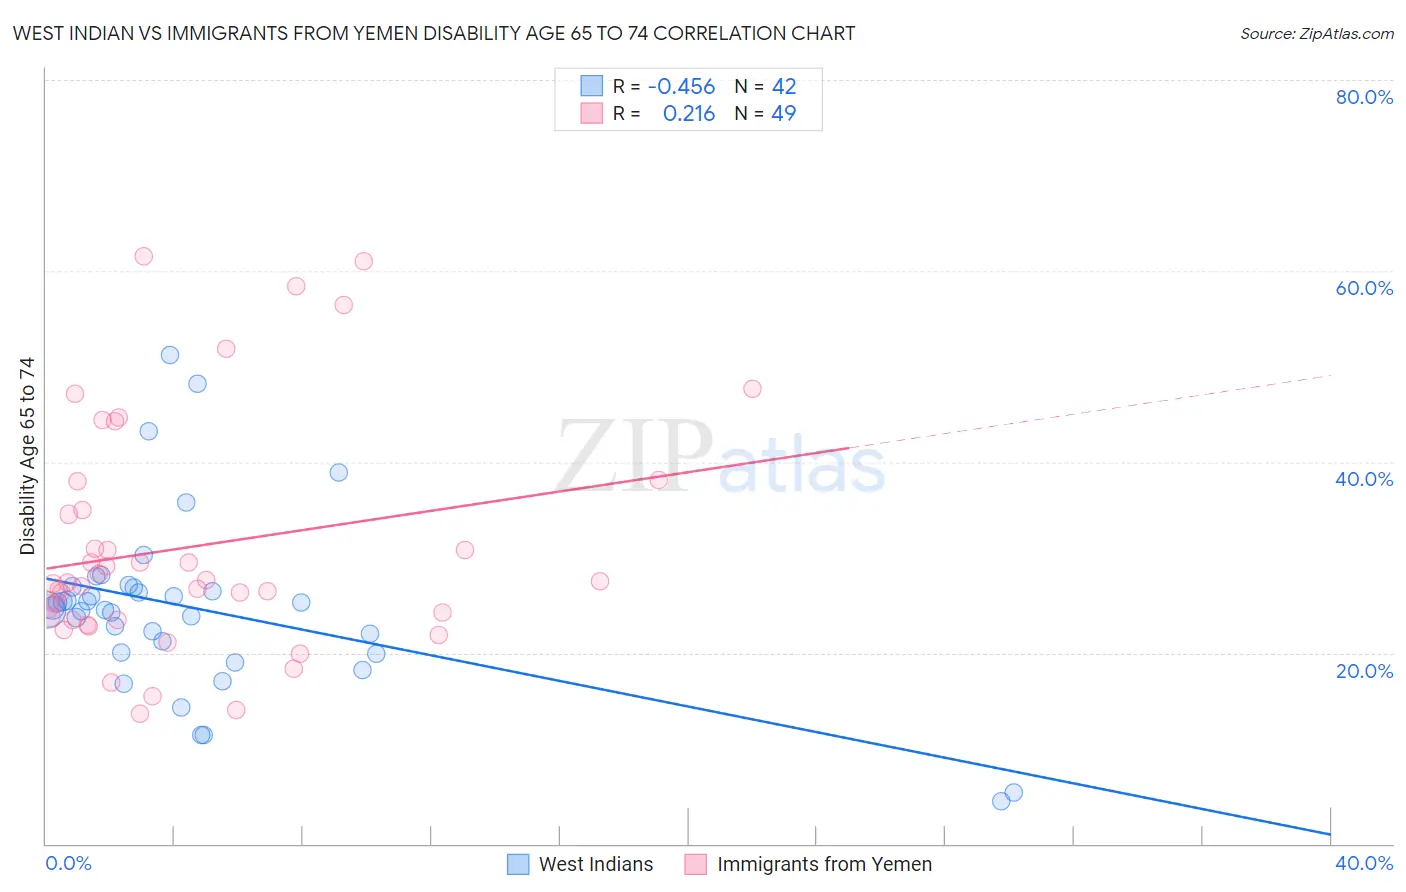
West Indian vs Immigrants from Yemen Disability Age 65 to 74 Correlation Chart
The statistical analysis conducted on geographies consisting of 253,647,264 people shows a moderate negative correlation between the proportion of West Indians and percentage of population with a disability between the ages 65 and 75 in the United States with a correlation coefficient (R) of -0.456 and weighted average of 24.5%. Similarly, the statistical analysis conducted on geographies consisting of 82,411,382 people shows a weak positive correlation between the proportion of Immigrants from Yemen and percentage of population with a disability between the ages 65 and 75 in the United States with a correlation coefficient (R) of 0.216 and weighted average of 27.0%, a difference of 10.3%.
Disability Age 65 to 74 Correlation Summary
| Measurement | West Indian | Immigrants from Yemen |
| Minimum | 4.5% | 13.6% |
| Maximum | 51.2% | 61.5% |
| Range | 46.7% | 48.0% |
| Mean | 24.6% | 31.1% |
| Median | 24.6% | 27.4% |
| Interquartile 25% (IQ1) | 20.1% | 23.5% |
| Interquartile 75% (IQ3) | 26.8% | 36.4% |
| Interquartile Range (IQR) | 6.7% | 13.0% |
| Standard Deviation (Sample) | 9.3% | 12.1% |
| Standard Deviation (Population) | 9.1% | 12.0% |
Similar Demographics by Disability Age 65 to 74
Demographics Similar to West Indians by Disability Age 65 to 74
In terms of disability age 65 to 74, the demographic groups most similar to West Indians are German Russian (24.4%, a difference of 0.10%), Scotch-Irish (24.4%, a difference of 0.14%), Immigrants from Ghana (24.5%, a difference of 0.17%), Panamanian (24.4%, a difference of 0.29%), and Immigrants from Caribbean (24.6%, a difference of 0.39%).
| Demographics | Rating | Rank | Disability Age 65 to 74 |
| Barbadians | 6.0 /100 | #230 | Tragic 24.3% |
| Immigrants | Thailand | 5.2 /100 | #231 | Tragic 24.3% |
| Immigrants | Zaire | 5.0 /100 | #232 | Tragic 24.3% |
| Bahamians | 4.5 /100 | #233 | Tragic 24.4% |
| Panamanians | 4.2 /100 | #234 | Tragic 24.4% |
| Scotch-Irish | 3.8 /100 | #235 | Tragic 24.4% |
| German Russians | 3.7 /100 | #236 | Tragic 24.4% |
| West Indians | 3.4 /100 | #237 | Tragic 24.5% |
| Immigrants | Ghana | 3.0 /100 | #238 | Tragic 24.5% |
| Immigrants | Caribbean | 2.6 /100 | #239 | Tragic 24.6% |
| Spaniards | 2.4 /100 | #240 | Tragic 24.6% |
| Immigrants | Western Africa | 2.3 /100 | #241 | Tragic 24.6% |
| Immigrants | Senegal | 2.2 /100 | #242 | Tragic 24.6% |
| Spanish | 2.2 /100 | #243 | Tragic 24.6% |
| Armenians | 2.0 /100 | #244 | Tragic 24.7% |
Demographics Similar to Immigrants from Yemen by Disability Age 65 to 74
In terms of disability age 65 to 74, the demographic groups most similar to Immigrants from Yemen are Fijian (27.0%, a difference of 0.020%), Potawatomi (27.0%, a difference of 0.030%), Immigrants from Dominican Republic (27.0%, a difference of 0.060%), Immigrants from Mexico (27.1%, a difference of 0.38%), and Central American Indian (27.1%, a difference of 0.39%).
| Demographics | Rating | Rank | Disability Age 65 to 74 |
| Spanish American Indians | 0.0 /100 | #291 | Tragic 26.4% |
| Blackfeet | 0.0 /100 | #292 | Tragic 26.6% |
| Immigrants | Central America | 0.0 /100 | #293 | Tragic 26.6% |
| Dominicans | 0.0 /100 | #294 | Tragic 26.7% |
| Hispanics or Latinos | 0.0 /100 | #295 | Tragic 26.7% |
| Bangladeshis | 0.0 /100 | #296 | Tragic 26.8% |
| Fijians | 0.0 /100 | #297 | Tragic 27.0% |
| Immigrants | Yemen | 0.0 /100 | #298 | Tragic 27.0% |
| Potawatomi | 0.0 /100 | #299 | Tragic 27.0% |
| Immigrants | Dominican Republic | 0.0 /100 | #300 | Tragic 27.0% |
| Immigrants | Mexico | 0.0 /100 | #301 | Tragic 27.1% |
| Central American Indians | 0.0 /100 | #302 | Tragic 27.1% |
| Tlingit-Haida | 0.0 /100 | #303 | Tragic 27.1% |
| Puget Sound Salish | 0.0 /100 | #304 | Tragic 27.2% |
| Mexicans | 0.0 /100 | #305 | Tragic 27.2% |